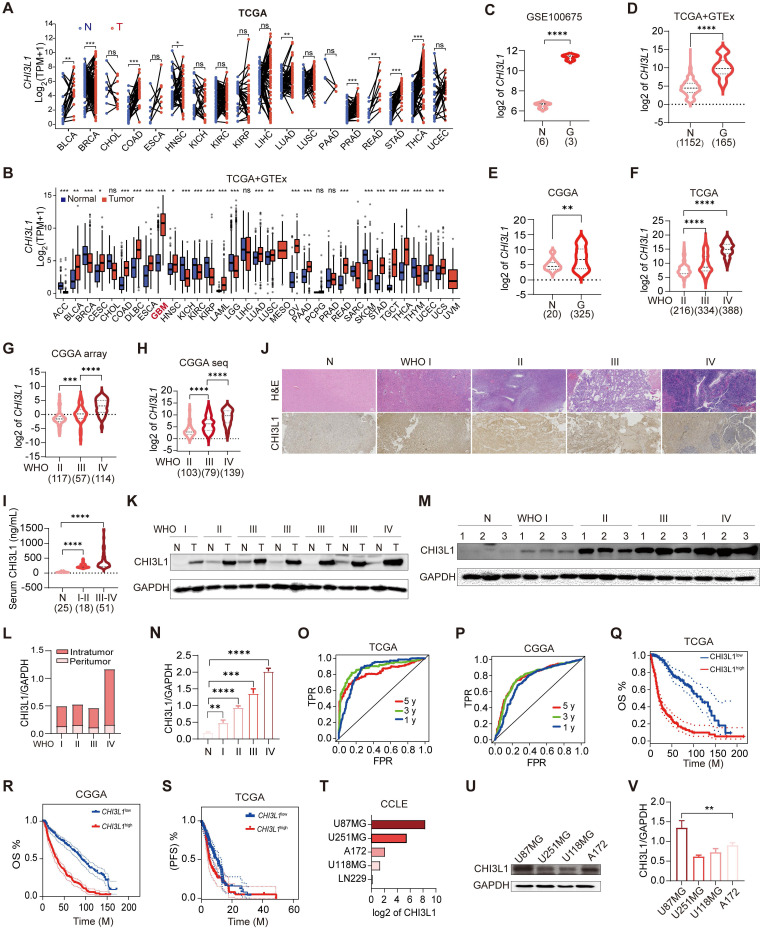
Figure 1.
CHI3L1 expression is correlated with the malignancy and OS of glioma. (A-B) The mRNA levels of CHI3L1 in 33 cancer types and paired normal tissues in TCGA. (C-E) CHI3L1 expression levels in normal and glioma tissues in GEO, TCGA and CGGA. (F-H) CHI3L1 expression levels in staged gliomas in GEO, TCGA and CGGA. (G) CGGA mRNA_array_301, (H) CGGA mRNAseq_325. (I) Serum levels of CHI3L1 in patients with glioma. (J) Representative pictures of H&E staining and IHC analysis of CHI3L1 expression levels in glioma and paired normal tissues; Scale bars represent 100 µm. (K-L) Western blot and quantitative analysis of CHI3L1 expression in seven pairs of glioma with different grades and paired normal tissues. (M-N) Western blot and quantitative analysis of CHI3L1 expression in normal tissues and staged gliomas. (O-P) ROC curve exhibited the sensitivity and specificity of CHI3L1 to predict glioma in TCGA and CGGA databases. (O) 5 y (AUC = 0.819), 3 y (AUC = 0.881), 1 y (AUC = 0.852). (P) 5 y (AUC = 0.784), 3 y (AUC = 0.782), 1 y (AUC = 0.741), y: year. TPR: true positive rate. FPR: False positive rate. (Q-S) Survival benefits between CHI3L1high and CHI3L1low groups (median was the cut-off to identify high and low groups) were assessed via Kaplan-Meier analysis using both the Log-rank and Wilcoxon-Breslow tests. (Q) Log-rank p = 0, HR (high) = 6.4, p (HR) = 0, n (high) = 338, n (low) = 337. (R) Log-rank p < 0.0001, Wilcoxon p < 0.0001. (S) Log-rank p = 0.0692, Wilcoxon p = 0.0243. (T) The mRNA expression profile of CHI3L1 in glioma cell lines from the CCLE. (U-V) Comparison of CHI3L1 expression levels in glioma cell lines analyzed by one-way analysis of variance (ANOVA). N: normal. G: glioma. T: tumors. OS: overall survival. PFS: progression-free survival. M: months. Student's t test, *p < 0.05; **p < 0.01; ****p < 0.0001.

