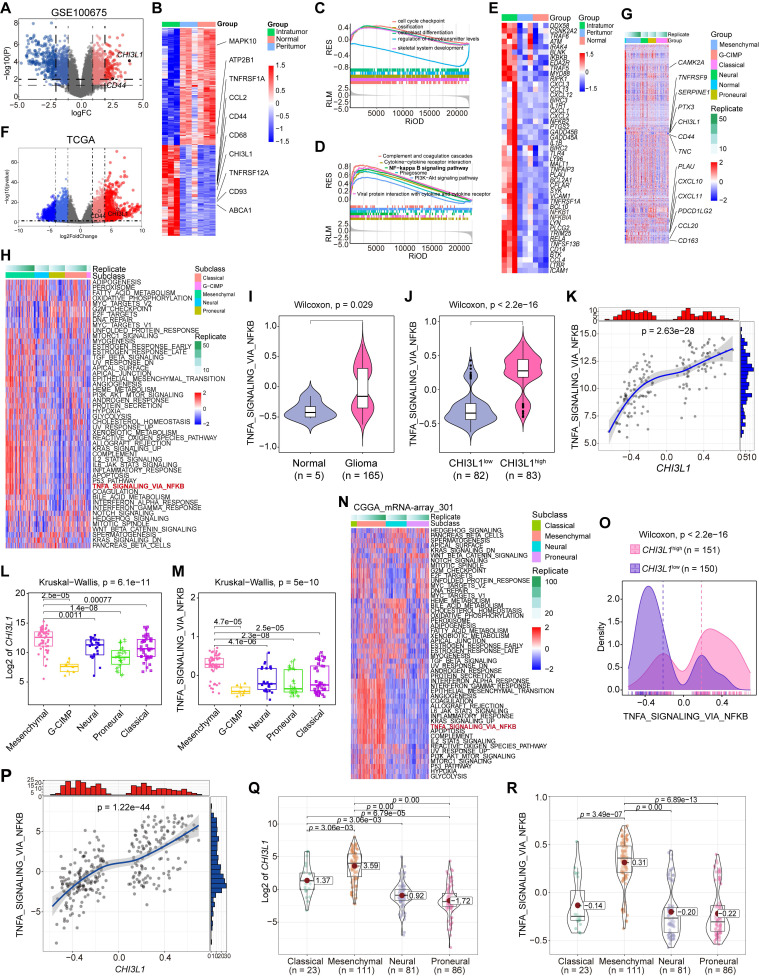
Figure 2.
CHI3L1 expression is associated with NF-κB pathway activation in glioma. (A-B) Volcano plot and heatmap of differentially expressed genes (DEGs) in GSE100675 dataset. (C-D) GO and GSEA based on DEGs identified in GSE100675. (E) Heatmap of genes targeting the NF-κB pathway in normal and tumors. (F-G) Volcano plot and heatmap of DEGs in TCGA glioma cohort. (H) Heatmap of 50 hallmark gene sets performed by GSVA in TCGA. (I-J) Enrichment score of TNFɑ NF-κB pathway among normal and tumor, as well as among CHI3L1high and CHI3L1low groups in TCGA, Wilcoxon test. (K) Spearman correlation analysis between the mRNA expression of CHI3L1 and NF-κB pathway enrichment score in TCGA. tstudent (163) = 13.48, rPearson = 0.73, CI95% [0.64, 0.79], npairs = 165. loge (BF01) = -57.89,  = 0.72,
  = [0.64, 0.79],
  = 1.41. (L-M) CHI3L1 expression and TNFɑ NF-κB pathway enrichment score between the five subclasses of glioma in TCGA, Kruskal-wallis test. (N) Heatmap of 50 hallmark gene sets by GSVA in CGGA mRNA-array 301 dataset. (O) Density plot showed the TNFɑ NF-κB pathway enrichment score between CHI3L1high and CHI3L1low groups in CGGA, Wilcoxon test. (P) Spearman correlation analysis between CHI3L1 expression and NF-κB pathway enrichment score in CGGA. tstudent (299) = 16.69, rPearson = 0.69, CI95% [0.63, 0.75], npairs = 301. loge (BF01) = -95.06,
  = 0.69,
  = [0.63, 0.75],
  = 1.41. (Q-R) Violin plot showed the expression of CHI3L1 and TNFɑ NF-κB pathway enrichment score between the four subclasses of glioma in CGGA, Kruskal-wallis test. (Q) Fwelch (3, 90.33) = 101.56, p = 7.72e-29, CI95% [0.69, 1.00], nobs = 301. (R) Fwelch (3, 89.73) = 103.07, p = 5.70e-29, CI95% [0.70, 1.00], nobs = 301. RES: Ranked Enrichment Score. RLM: Ranked List Metric. RiOD: Rank in Ordered Dataset.

