Figure 3.
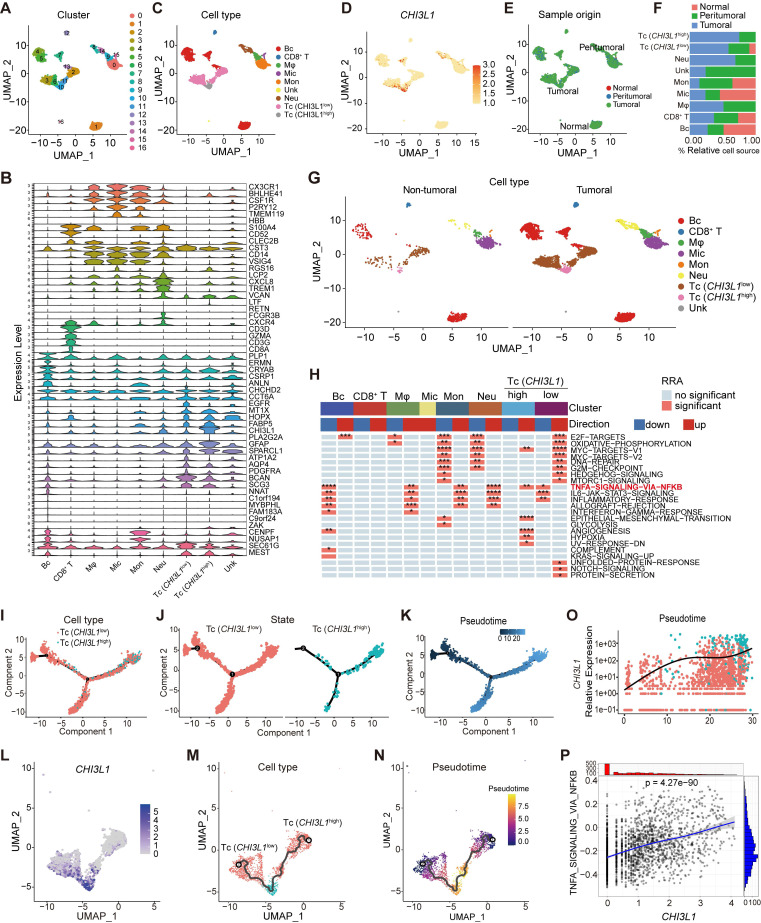
CHI3L1high specific glioma cells dominantly drive the activation of the NF-κB pathway. UMAP plot of total cells from patients with staged gliomas, with each cell color coded for cluster (A), cell type (C), and sample origin (E-F). (B) Violin plot showed marker genes for cell annotation. (D) CHI3L1 expression profiles in all cells in the UMAP plot. (G) UMAP plot of all cells in tumoral and non-tumoral regions coded for cell type. (H) Heatmap of 50 hallmark gene sets in eight identified cell clusters using singscore. (I-K) Unsupervised transcriptional trajectory of CHI3L1high and CHI3L1low glioma cells, coded by cell type, state, and pseudotime. (L) UMAP dot plot of CHI3L1 expression levels in gliomas. (M-N) Pseudotime trajectory of CHI3L1high and CHI3L1low glioma cells in the UMAP dot plot. (O) Dynamic changes in CHI3L1 expression levels in all glioma cell types and across pseudotime. (P) The correlation between expression of CHI3L1 and NF-κB pathway enrichment score. tstudent (1954) = 21.22, rPearson = 0.43, CI95% [0.40, 0.47], npairs = 1956. loge (BF01) = -198.95,  = 0.43,
  = [0.40, 0.47],
  = 1.41. Bc: brain cell, Mφ: Macrophage, Mic: Microglia, Mon: Monocyte, Unk: Unknown, Neu: Neutrophil, Tc: Tumor cell. *p < 0.05; **p < 0.01; ***p < 0.001; ****p < 0.0001.

