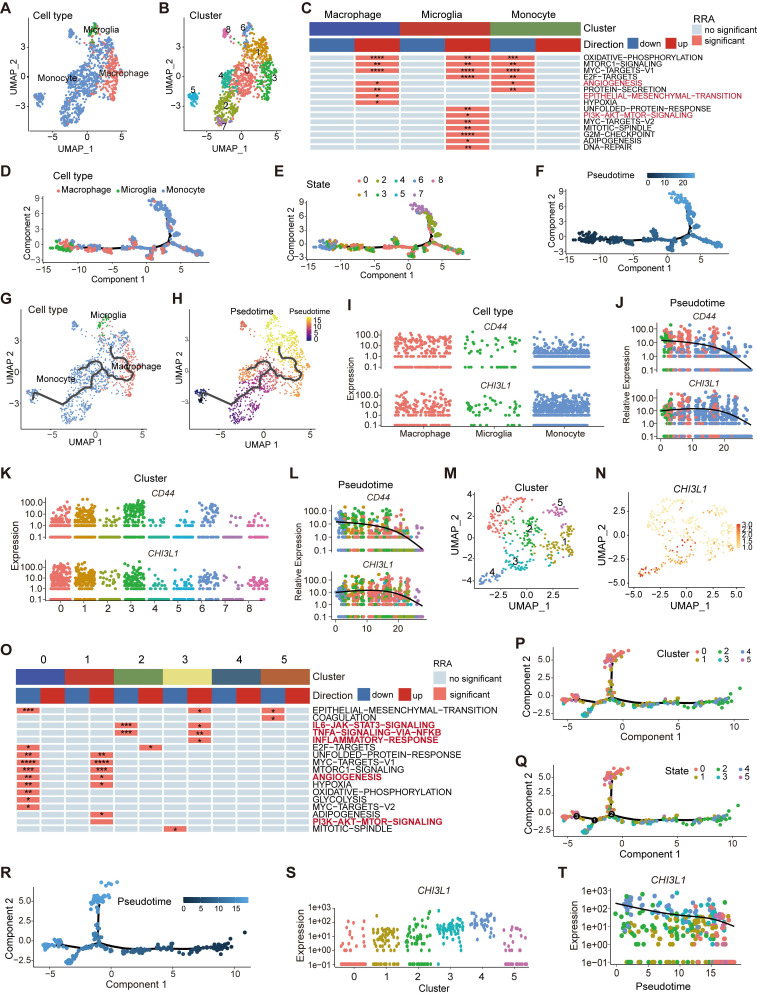
Figure 6.
Myeloid landscape delineation in human glioma. UMAP plot of monocyte, microglia and macrophage populations (A), with each cell color coded for cluster (B). (C) Heatmap of hallmark gene sets with significant difference using singscore. (D-F) Pseudotime trajectory of monocyte, microglia, and macrophage state transition inferred by Monocle 2 and characterized by cell type (D), state (E), and pseudotime (F). (G-H) Trajectory of monocytes, microglia, and macrophage state transition in UMPA plot. (I-L) Dynamic changes of the CHI3L1 and CD44 expression during the state transition profile coded for cell type (I), cluster (K), and pseudotime (J, L). (M) UMAP dot plot of neutrophil from 13 patients, with each cell color coded for cluster. (N) Expression profile of CHI3L1 in neutrophils in the UMAP plot. (O) Heatmap of hallmark gene sets with significant difference in neutrophils performed by singscore. (P-R) Trajectory analysis of neutrophils annotated by cluster, state and pseudotime. (S-T) Expression profiles (S) and dynamic changes (T) of CHI3L1 among subclusters of neutrophils. *p < 0.05; **p < 0.01; ***p < 0.001; ****p < 0.0001.

