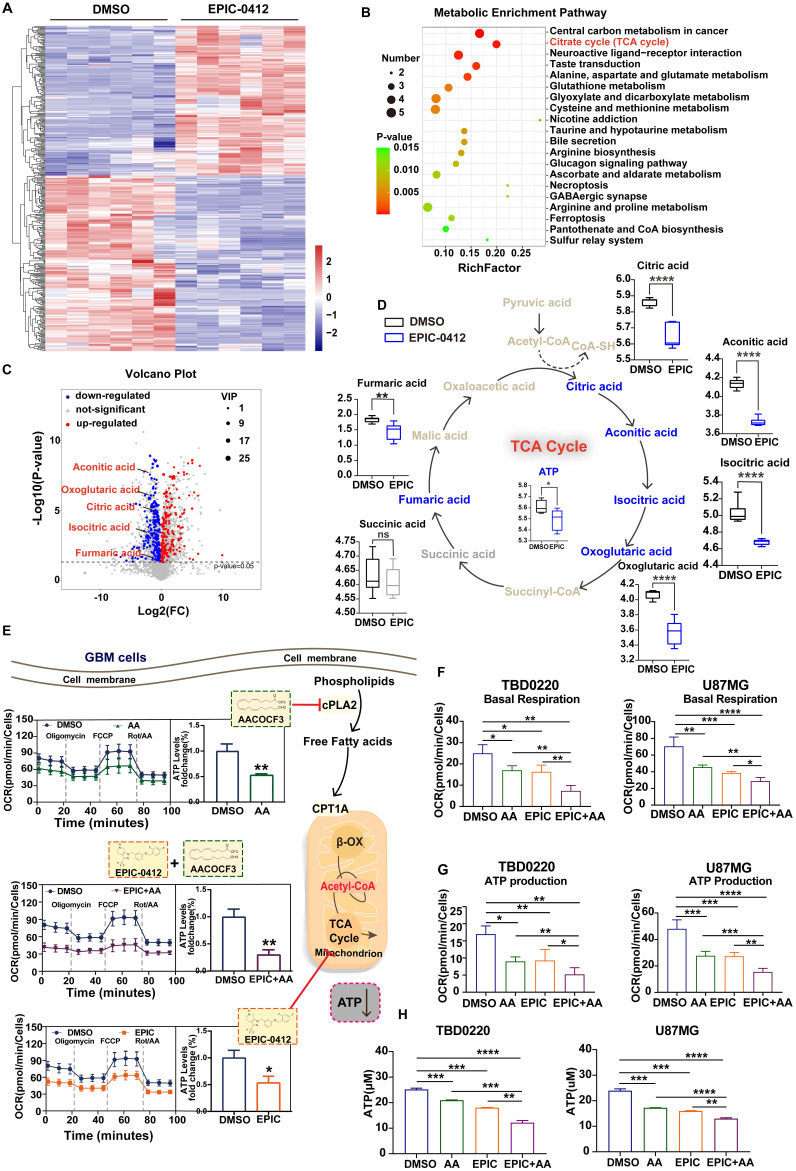
Figure 1.
EPIC and AA disrupt the TCA cycle as well as phospholipid metabolism and account for a synergistic effect on ATP production inhibition. (A) Heatmap of metabolite changes in TBD0220 cells treated with or without EPIC (20 µM) detected via non-targeted metabolomic analysis (DMSO group, n = 6; EPIC group, n = 6). (B) Pathway analysis of significantly affected metabolites in TBD0220 cells treated with EPIC in (A) (FC > 2, p < 0.05, and VIP > 1). (C) A volcano plot analysis was performed on a non-targeted metabolomic study. Key metabolites, including citric acid, aconitic acid, isocratic acid, α-oxoglutaric acid, and fumaric acid, were significantly downregulated following EPIC treatment in GBM cells. Each spot represents a metabolite, upregulated metabolites are shown in red, and downregulated metabolites are shown in blue. Significant changes are denoted by FC > 2, p < 0.05, and VIP > 1. (D) Representation of the TCA cycle and energy metabolites, box plots show relative abundances of metabolites after normalization. Metabolites shown in blue were decreased, metabolites shown in gray were non-significant, and metabolites indicated in brown remained undetected. (n = 6 per group) (E) The general scheme of the TCA cycle and lipid metabolism as the therapeutic target of EPIC (20 µM) or/and AA (25 µM) for 24 h in TBD0220 cells. The oxygen consumption rate (OCR) of TBD0220 cells was measured on a Seahorse Flux Analyzer (n = 3-4). (F-G) Measurements of basal respiration and ATP production in TBD0220 (F) or U87MG (G) cells. (H) Measurement of the intracellular total ATP concentration in TBD0220 or U87MG cells (n = 3 per group). All data are shown as the mean values ± SD, p values are based on Student's t-test, one-way ANOVA. ****p < 0.0001, ***p < 0.001, **p < 0.01, *p < 0.05; ns, nonsignificant.

