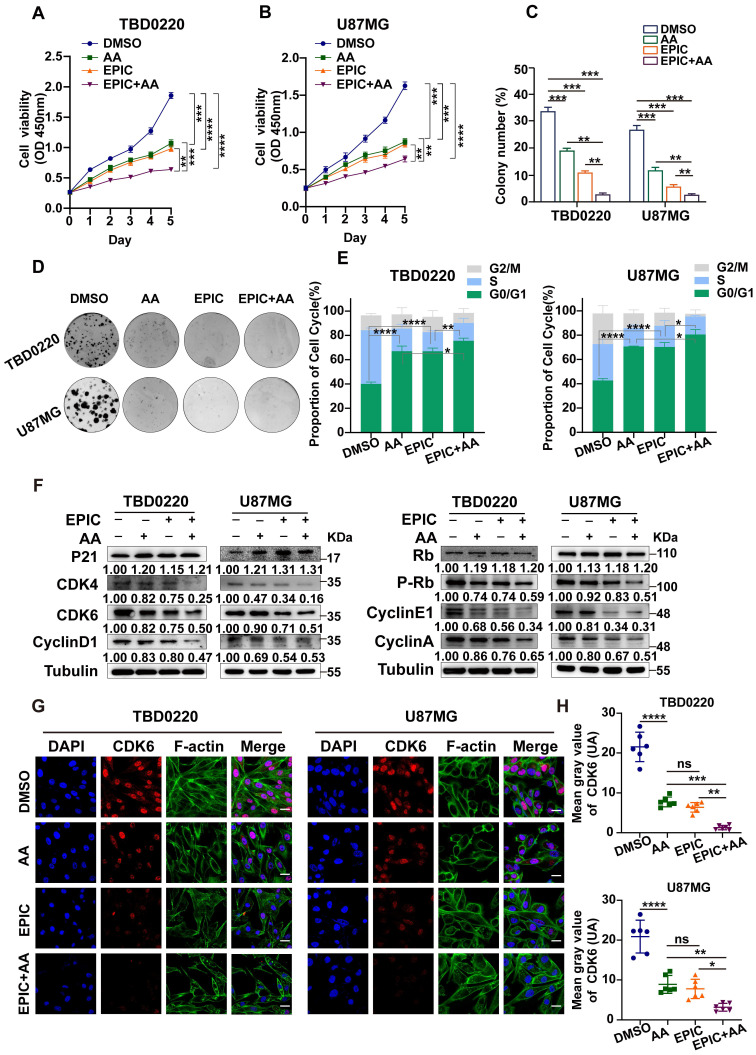
Figure 3.
Reduction in ATP production hinders cell proliferation and contributes to G1/S arrest in GBM. (A-B) The relative viability of TBD0220 (A) and U87MG (B) cells was measured using a CCK-8 kit (n = 3). (C-D) Colony formation assay to detect GBM cell growth (D), and the quantification of colony numbers (C) (n = 3). (E) Cell cycle analysis using flow cytometry after incubation with different treatments like EPIC (20 µM), AA (25 µM), or EPIC (20 µM) + AA (25 µM) for 48 h, and the results are plotted as a histogram (n = 3) (F) Representative western blotting showing the expression of p21 and Rb and their downstream targets. The results were normalized to Tubulin with the control group as 1. Protein expression was quantified by ImageJ. (G) Representative confocal images of CDK6 after the treatment with AA (25 µM), EPIC (20 µM), or EPIC (20 µM) + AA (25 µM) for 48 h (n = 6). (H) The quantitative analysis of fluorescence images of CDK6 (n = 6). All data are shown as the mean values ± SD, and p values are based on one-way or two-way ANOVA. ****p < 0.0001, ***p < 0.001, **p < 0.01, *p < 0.05. Scale bar = 20 μm.

