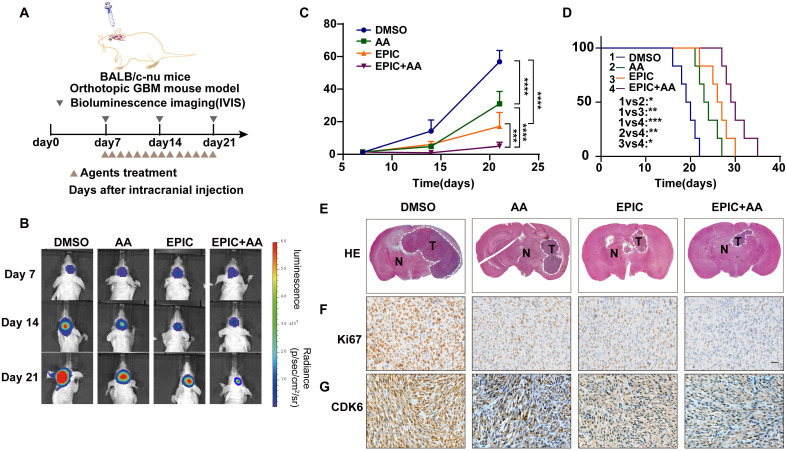
Figure 5.
Disruption of phospholipid metabolism and the TCA cycle suppresses tumor growth and prolongs survival in vivo. (A) Schematic of the patient-derived GBM intracranial xenograft model in BALB/c nude mice (n = 7 for each group). (B) Representative tumor bioluminescence images of mice from four groups DMSO-treated, AA-treated (25 mg/kg), EPIC-treated (15 mg/kg), and EPIC (15 mg/kg) + AA-treated (25 mg/kg) mice at 7, 14, and 21 days after tumor implantation. (C) Quantification of bioluminescence imaging signal intensities from all groups (n = 6-7). (D) Survival rates of mice with indicated treatments are exhibited by the Kaplan-Meier survival plot (n = 6-7). (E) Representative images of H&E staining showing tumor volume in the nude mice (T denotes tumor, N denotes normal brain tissue). Images were collected on an Olympus instrument and are displayed at a 10× magnification. (F-G) Representative images of IHC staining for Ki67 and CDK6 in tumor tissues from patient-derived xenograft models. All data are shown as the mean values ± SD, and p values are based on one-way ANOVA. ****p< 0.0001, ***p < 0.001, **p < 0.01, *p < 0.05. Scale bar = 50 μm.

