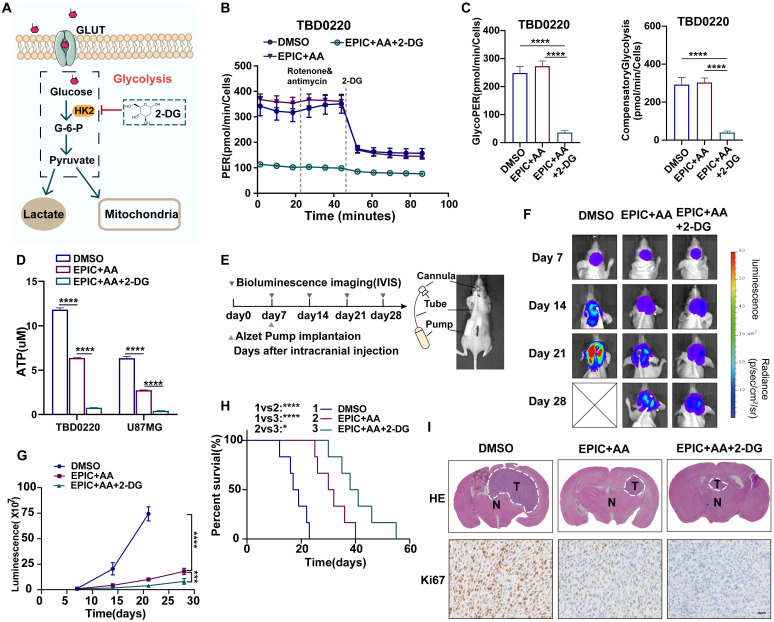
Figure 6.
Targeting the TCA-phospholipid-glycolysis axis by triple therapy in GBM leads to growth inhibition in vitro and in vivo. (A) HK2-mediated glycolysis could be disrupted by 2-DG. (B) PER was measured by glycolysis rate kit on a Seahorse Analyzer in TBD0220 cells after the treatment with DMSO, EPIC (20 µM) + AA (25 µM) or EPIC (20 µM) + AA (25 µM) + 2-DG (50 mM) for 24 h (n = 3-4 replicates per group). (C) The measurement of glycolytic proton efflux rate (glycoPER), namely basal glycolysis, and compensatory glycolysis rate in TBD0220 cells (n = 3-4). (D) Measurements of the intracellular total ATP concentrations in TBD0220 and U87MG cells (n = 3). (E) CDE with Alzet micro-osmotic pumps was implanted under the skin of tumor-bearing mice (n = 7 for each group). (F) Representative bioluminescence images of intracerebral cancer mice that were treated with DMSO, the dual therapy of AA (25 mg/kg) and EPIC (15 mg/kg), or the triple therapy of AA (25 mg/kg), EPIC (15 mg/kg), and 2-DG (15 mg/kg) at days 7, 14, 21, and 28 post-implantation. (G) Quantitation of bioluminescence signals (n = 6-7). (H) Kaplan-Meier survival curve shows the overall survival of mice in (E) (n = 6-7). (I) Representative brain images from mice with indicated treatments and corresponding H&E (T denotes tumor, N denotes normal brain tissue) and IHC staining images of Ki67. All data are shown as the mean values ± SD, and p values are based on one-way or two-way ANOVA. ****p< 0.0001, ***p < 0.001, *p < 0.05. Scale bar = 50μm.

