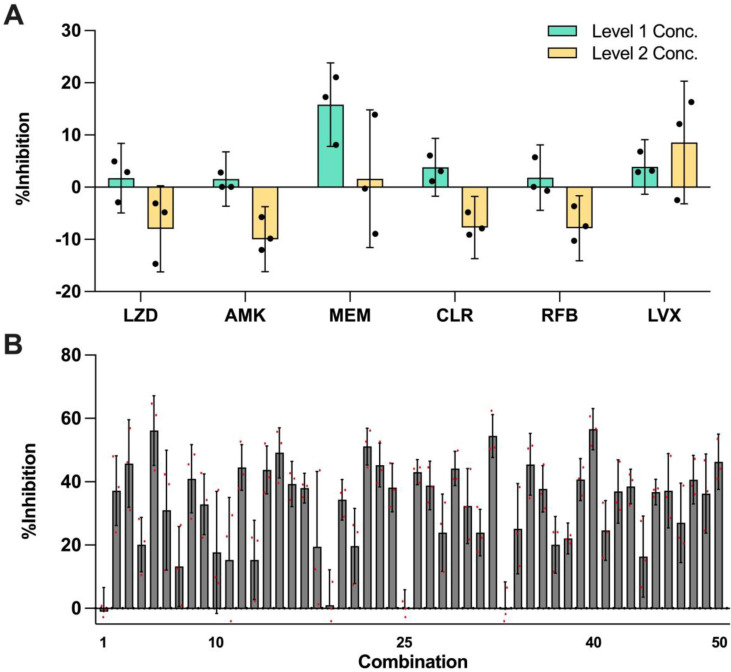
Figure 2.
Efficacy of monotherapies and OACD-designed combinations. (A) Experimentally measured %Inhibitions for all 6 selected drugs at level 1 (green) and level 2 (yellow) concentrations. The error bars represent the propagated SD, arising from the spread of controls, and each individual replicate is represented in black dots. (B) All 50 OACD-designed combinations were experimentally validated, and their corresponding average %Inhibitions are plotted. The combinations are in order in accordance to the design in Table S1, and each replicate is represented in red dots. The monotherapy and combinatorial experiments were performed in the same experiment, and data points are presented as mean ± propagated SD (N = 3). Experimental data are summarized in Table S3 and S4. Level 1 Conc.: level 1 concentration, Level 2 Conc.: level 2 concentration, AMK: amikacin, CLR: clarithromycin, LVX: levofloxacin, LZD: linezolid, MEM: meropenem, and RFB: rifabutin.

