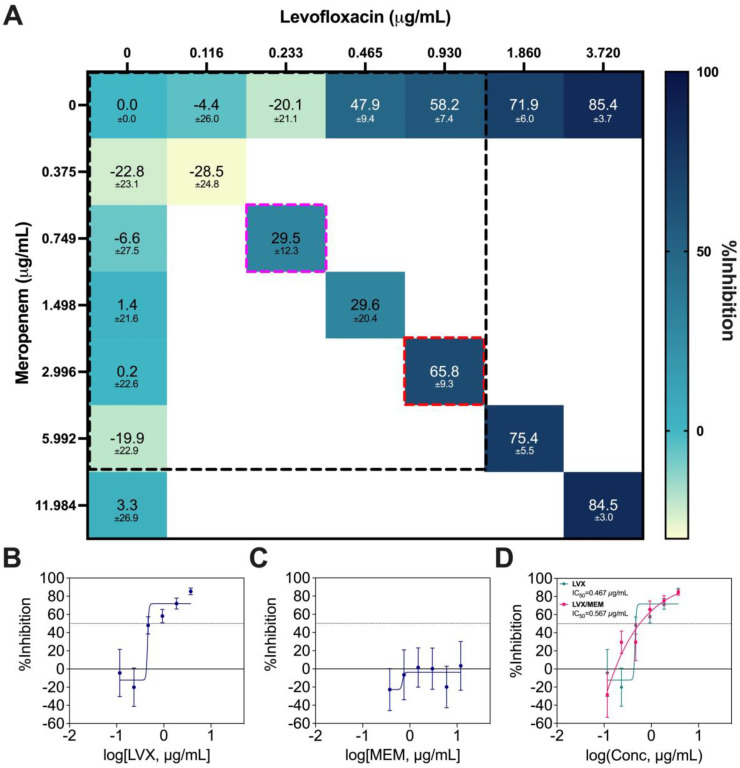
Figure 7.
DiaMOND synergy analysis of LVX/MEM. (A) Interaction map of LVX/MEM with measured %Inhibitions at each corresponding dose ratios, and the clinically actionable interaction space (< 10% Cmax) is within the dotted black box. The dotted red box represents the combination in original IDentif.AI concentrations (level 2), and the dotted pink box represents the 4-fold MIC shift of the originally identified synergy (N = 3). (B-C) Dose response curves of LVX and MEM in monotherapies, and the dotted line represents absolute IC50. Data points are presented as mean ± propagated SD (N = 3). (D) Dose response curve of LVX in monotherapy and in combination with MEM. The IC50 values for LVX and LVX/MEM are summarized in the legend. The dotted line represents absolute IC50. Data points are presented as mean ± propagated SD (N = 3). Experimental data are summarized in Table S9. LVX: levofloxacin and MEM: meropenem.

