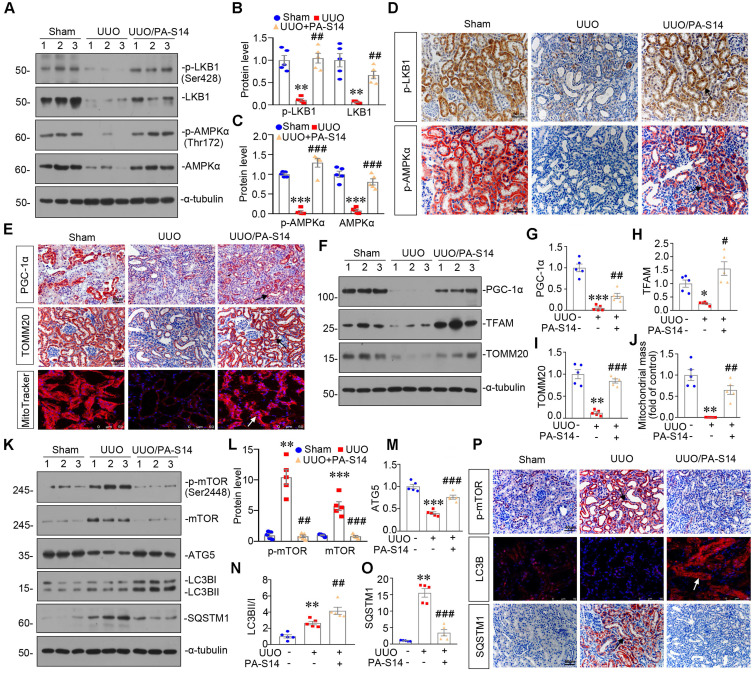
Figure 12.
PA-S14 induces autophagy and restores mitochondrial biogenesis in UUO mice via activating LKB1/AMPK signaling. (A-C) Representative western blot and quantitative data showing renal expression of p-LKB1, LKB1, p-AMPKα, and AMPKα in different groups. Numbers (1-3) indicate each individual animal in a given group. **P < 0.01, ***P < 0.001 versus sham controls; ##P < 0.01, ###P < 0.001 versus UUO (n = 5). (D) Representative micrographs show the p-LKB1 and p-AMPKα expression in different groups as indicated. Kidney sections were stained with antibodies against p-LKB1 and p-AMPKα. Arrows indicate positive staining. Scale bar, 50 µm. (E) Representative micrographs show the expression of PGC-1α, TOMM20 and Mitochondrial mass. Paraffin kidney sections were stained with antibodies against PGC-1α and TOMM20. The frozen kidney sections were stained with MitoTracker deep red (3 µm) probe. DAPI (4′,6‐diamidino‐2‐phenylindole) was used to stain the nuclei (blue). Arrows indicate positive staining. Scale bar, 50 µm. (F-I) Representative western blot and quantitative data showing renal expression of the PGC‐1α, TFAM and TOMM20 in different groups. Numbers (1-3) indicate each individual animal in a given group. *P < 0.05, **P < 0.01, ***P < 0.001 versus sham controls; #P < 0.05, ##P < 0.01, ###P < 0.001 versus UUO (n = 5). (J) Quantification of renal mitochondrial mass is shown. Mitochondrial mass was determined by the fluorescence intensity of MitoTracker deep red staining normalized to DAPI. **P < 0.01 versus sham controls; ##P < 0.01 versus UUO (n = 5). (K-O) Representative western blot and quantitative data showing renal expression of the LC3BII/I ratio, SQSTM1, ATG5, p-mTOR, and mTOR in different groups. Numbers (1-3) indicate each individual animal in a given group. **P < 0.01, ***P < 0.001 versus sham controls; ##P < 0.01, ###P < 0.001 versus UUO (n = 5). (P) Representative micrographs show renal expression of p-mTOR, LC3B, and SQSTM1. Paraffin kidney sections were stained with antibodies against p-mTOR and SQSTM1. The frozen kidney sections were stained with an antibody against LC3B. Arrows indicate positive staining. Scale bar, 50 µm.

