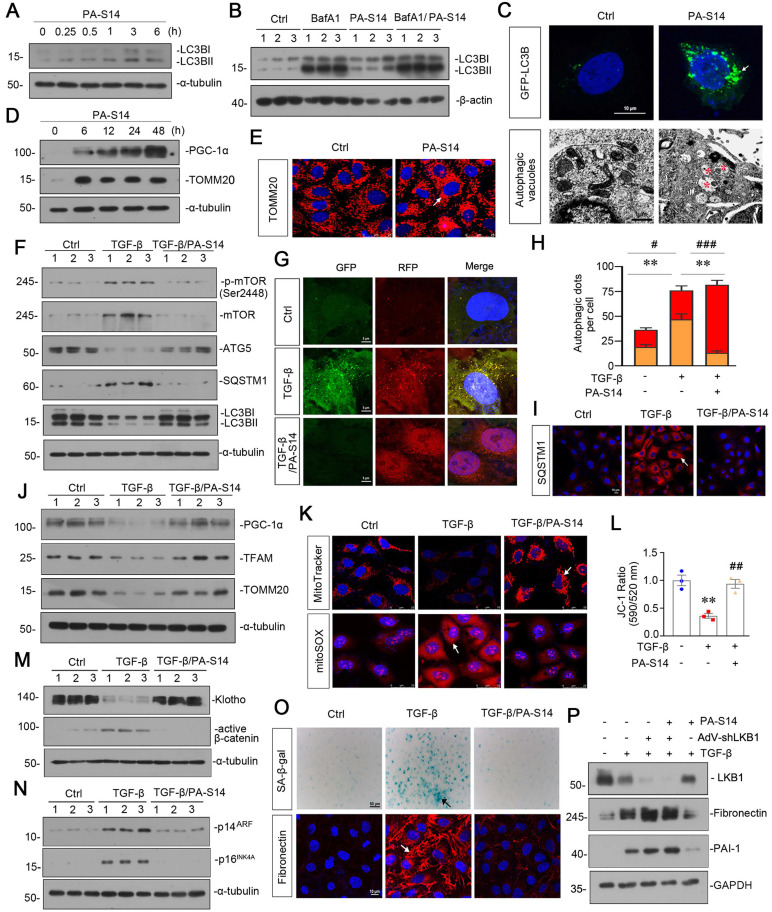
Figure 3.
PA-S14 promotes autophagic flux and mitochondrial biogenesis through LKB1 signaling in vitro. (A) HKC‐8 cells underwent PA-S14 (0.5 µM) treatment for the indicated time period (0, 0.25, 0.5, 1, 3, 6 h). The expressional level of LC3BII/LC3BI ratio was then detected by western blotting. (B) HKC-8 cells were pretreated with PA-S14 (0.5 µM) for 1 h, followed by the stimulation of 100 nM of bafilomycin A1 (Baf A1) for 6 h. LC3BII/I ratio was analyzed by western blotting. (C) Representative micrographs showed that PA-S14 enhanced LC3BII punctae formation. HKC-8 cells were transiently transfected with GFP-LC3B plasmid for 24 h and were then stimulated with or without PA-S14 (0.5 µM) for another 24 h. The cells were observed by fluorescence microscopy. Arrows indicate positive staining. Scale bar, 10 µm. Representative electron microscopy (TEM) micrographs showed that PA-S14 increased autophagic vacuoles (red asterisks). HKC-8 cells were treated with PA-S14 (0.5 µM) for 24 h. Scale bar, 1 µm. (D) HKC‐8 cells were treated with PA-S14 (0.5 µM) for indicated time period (0, 6, 12, 24, 48 h). The expression levels of PGC-1α and TOMM20 were then assessed by western blotting. (E) Representative micrographs showing the immunofluorescence staining of TOMM20. HKC‐8 cells were treated with PA-S14 (0.5 µM) for 24 h. Arrows indicate positive staining. Scale bar, 25 µm. (F) Representative western blot showing the expression of the LC3BⅡ/Ⅰ ratio, SQSTM1, ATG5, p-mTOR, and mTOR in different groups. HKC‐8 cells were pretreated with PA-S14 (0.5 µM) for 1 h, and then treated with TGF-β1 (5 ng/ml) for 24 h. Numbers (1-3) indicate each individual culture in a group (n = 3). (G) Representative micrographs show that PA-S14 promoted autophagic flux. HKC-8 cells were pretransfected with lentivirus expressing RFP-GFP-LC3B for 24 h and were then stimulated by TGF-β1 (5 ng/ml) for 24 h with or without PA-S14 (0.5 µM). Natural-pH LC3B-positive autophagosomes (green fluorescence) and acidic-pH LC3B-positive autophagolysosomes (red fluorescence) were assessed. (H) Natural-pH LC3B-positive autophagosomes (green fluorescence) and acidic-pH LC3B-positive autophagolysosomes (red fluorescence) were assessed. Quantitative data of autophagosomes (gold) and autophagolysosomes (red) for Figure 3G. **P < 0.01 versus TGF-β1 alone (autophagosomes); #P < 0.05, ###P < 0.001 versus TGF-β1 alone (autophagolysosomes) (n = 10). (I) Representative fluorescence micrographs show SQSTM1 staining. HKC‐8 cells were pretreated with PA-S14 (0.5 µm) for 1 h and then treated with TGF-β1 (5 ng/ml) for 12 h. Cells were stained with an antibody against SQSTM1 (red) and counterstained with DAPI (blue). Arrows indicate positive staining. Scale bar, 10 µm. (J) Representative western blot showing the expression of PGC‐1α, TFAM and TOMM20. HKC‐8 cells were treated with TGF-β1 (5 ng/ml) alone or cotreated with PA-S14 (0.5 µM) for 24 h. Numbers (1-3) indicate each individual culture in a group. (K) Representative MitoTracker and mitoSOX staining micrographs show the mitochondrial mass and ROS production. After pretreatment with PA-S14 (0.5 µM) for 1 h, HKC‐8 cells were treated with TGF-β1 (5 ng/ml) for 24 h. Arrows indicate positive staining. Scale bar, 25 µm. (L) Graphical representation of mitochondrial membrane potential (MMP). MMP was detected by JC‐1 staining and analyzed by flow cytometry. After pretreatment with PA-S14 (0.5 µM) for 1 h, HKC‐8 cells were treated with TGF-β1 (5 ng/ml) for 12 h and then stained with JC‐1 dye. The MMP is shown as the ratio of the fluorescence intensity at absorbance of 590 nm (JC‐1 aggregate) to 520 nm (JC‐1 monomer). **P < 0.01 versus control group; ##P < 0.01 versus TGF-β1 group. (M, N) Representative western blot showing the expression of Klotho and active β-catenin. HKC‐8 cells were pretreated with PA-S14 (0.5 µM) for 1 h and then treated with TGF-β1 (5 ng/ml) for 24 h. Representative western blot showing the expression of p14ARF and p16INK4A in different groups. HKC‐8 cells were pretreated with PA-S14 (0.5 µM) for 1 h and then treated with TGF-β1 (5 ng/ml) for 60 h. Numbers (1-3) indicate each individual culture in a group. (O) Representative micrographs show SA‐β‐gal activity staining and the immunofluorescence staining of Fibronectin. After pretreatment with PA-S14 (0.5 µM) for 1 h, HKC‐8 cells were treated with TGF-β1 (5 ng/ml) for 60 h to test SA‐β‐gal activity. Arrows indicate positive staining. Scale bar, 50 µm. HKC‐8 cells were pretreated with PA-S14 (0.5 µM) for 1 h and then treated with TGF-β1 (5 ng/ml) for 24 h to test Fibronectin expression. Arrows indicate positive staining. Scale bar, 10 µm. (P) Representative western blot showing the expression of Fibronectin and PAI-1 in different groups. HKC-8 cells were infected with adenovirus expressing LKB1 shRNA (sh-LKB1), followed by pretreatment with PA-S14 (0.5 µM) for 1 h, and then treated with TGF-β1 (5 ng/ml) for another 24 h.

