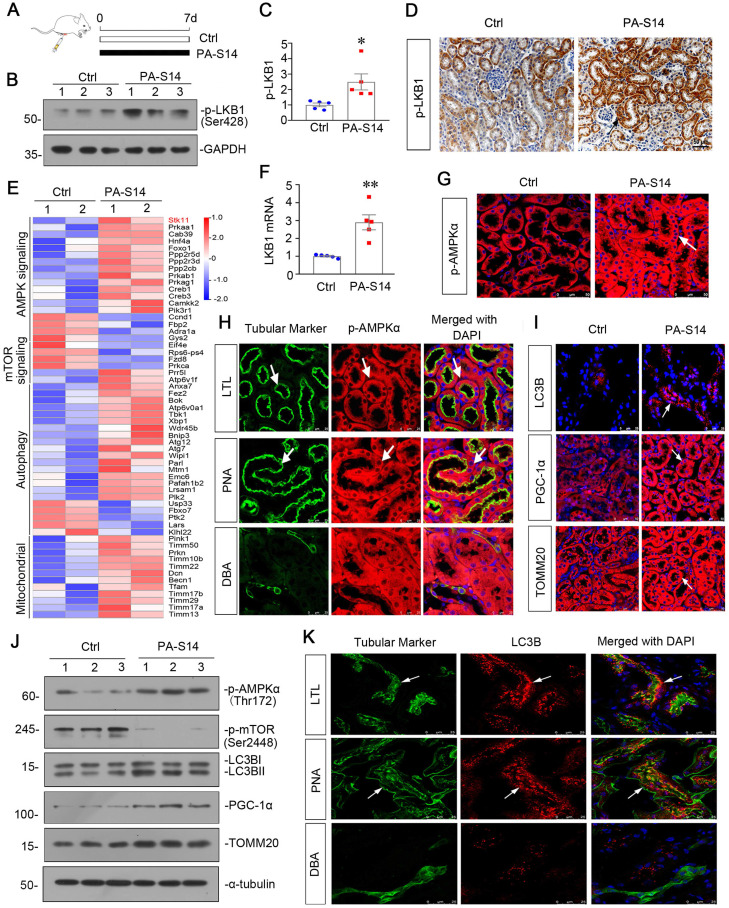
Figure 4.
PA-S14 induces autophagy and mitochondrial biogenesis in healthy mice through LKB1/AMPK signaling. (A) Diagram shows the experimental design. Black line indicates PA-S14 treatment (1.0 mg/kg body weight). (B-C) Representative western blot and quantitative data showing renal expression of p-LKB1. Numbers (1-3) indicate each individual animal in a given group. *P < 0.05 versus control mice (n = 5). (D) Representative micrographs show renal expression of p-LKB1. Paraffin kidney sections were immunostained with an antibody against p-LKB1. Arrow indicates positive staining. Scale bar, 50 µm. (E) Representative heatmap gene expression of RNA sequencing analysis show several important pathways involving AMPK signaling, mTOR signaling, autophagy and mitochondria. (F) Graphic presentation shows the relative levels of renal expression of LKB1 mRNA in two groups as indicated. **P < 0.01 versus control mice (n = 5). (G) Representative micrographs show renal expression of p-AMPKα. Frozen kidney sections were stained for p-AMPKα. Arrows indicate positive staining. Scale bar, 50 µm. (H) Double immunofluorescence staining demonstrates the expression of p‐AMPKα predominantly in the proximal tubular and distal tubular epithelium. Kidney sections were co-stained for p‐AMPKα (Red) and various segment-specific tubular markers (green), respectively. Segment-specific tubular markers were used as follows: lotus tetragonolobus lectin (LTL); distal tubule, peanut agglutinin (PNA); and collecting duct, dolichos biflorus agglutinin (DBA). Arrows indicate positive tubules with colocalization of p-AMPKα and specific tubular markers. Scale bar, 25 µm. (I) Representative micrographs show renal expression of LC3B, PGC-1α, and TOMM20. Frozen kidney sections were stained for LC3B, PGC-1α, and TOMM20. Arrows indicate positive staining. Scale bar, 25 or 50 µm. (J) Representative western blot showing renal expression of p-AMPKα, p-mTOR, LC3B, PGC-1α, and TOMM20. Numbers (1-3) indicate each individual animal in a given group. (K) Double immunofluorescence staining demonstrates the expression of LC3B predominantly in the proximal tubular and distal tubular epithelium. Scale bar, 25 µm.

