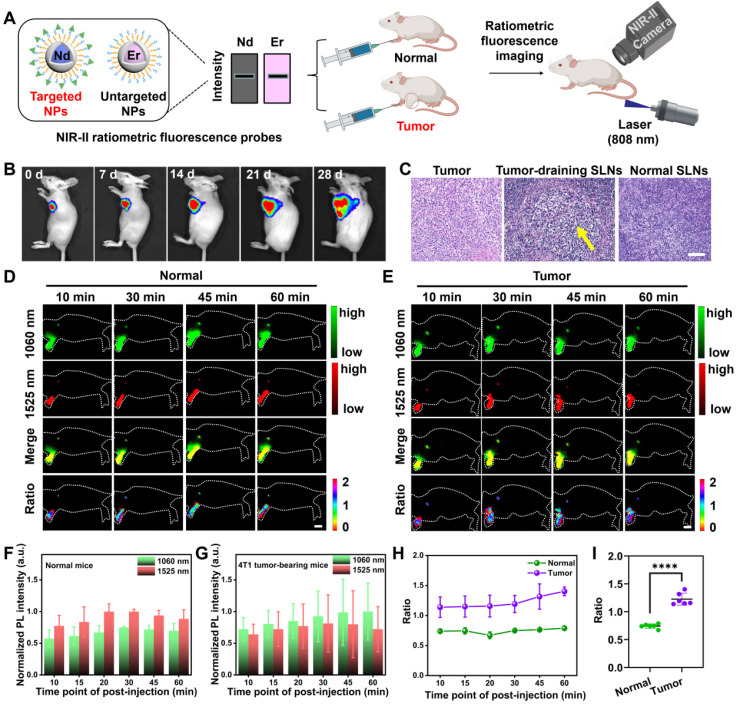
Figure 2.
In vivo dual-channel NIR-II fluorescence imaging for mapping SLNs. (A) Schematic illustration outlining NIR-II ratiometric fluorescence imaging of SLNs in two animal models using probes. Images were created with BioRender.com. (B) Tumor progression and metastasis to SLNs were monitored by the bioluminescence of luciferase-transfected 4T1 cells. (C) H&E staining of excised SLNs and tumors verified the presence of metastasis in SLNs. (D-E) In vivo NIR-II fluorescence images under two channels and the corresponding merging and ratio images of SLNs in normal and tumor-metastatic mice excited by a single 808 nm laser (65 mW/cm2, 100 ms). Scale bar: 1 cm. The normalized fluorescence intensities from 1060 and 1525 nm channels of SLNs in normal mice (F) and tumor metastatic mice (G) were plotted against different post-injection time points. The error bars represented mean ± SD are generated from n = 3 biologically independent mice for each group. The collected signals were further normalized by the highest fluorescence intensity among the post-injection time-points. (H) NIR-II ratiometric signals of I1060 nm/I1525 nm of SLNs were obtained from two cohorts of normal and tumor metastatic mice over time. (I) Evaluation of the ratiometric signals of two groups. A lower value was observed for normal groups. The bars represent ± SD, ****P < 0.0001.

