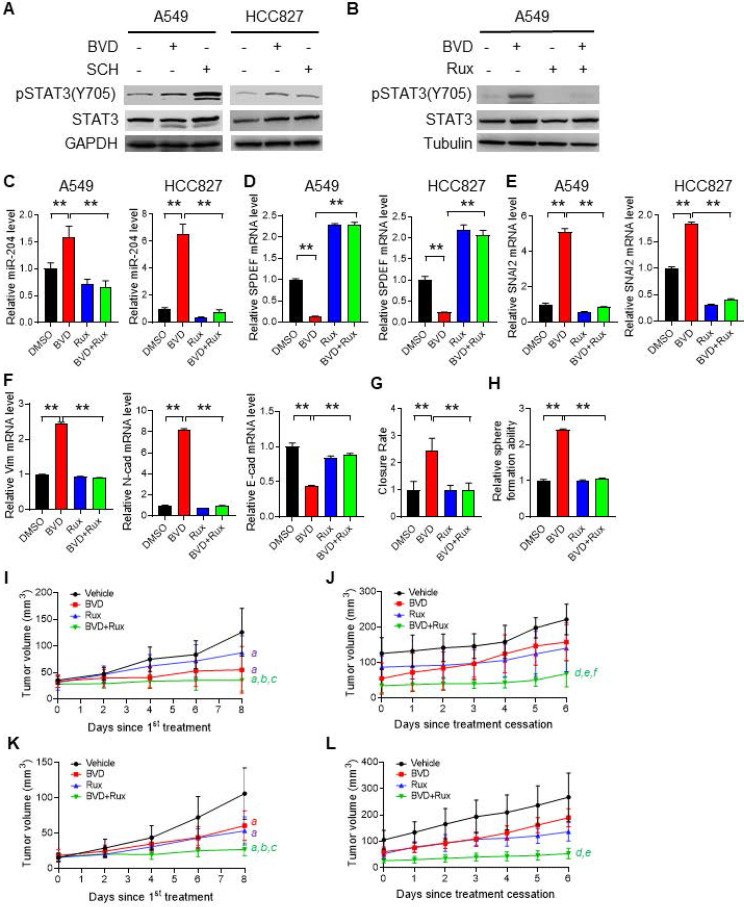
Figure 6.
The contribution of the JAK-STAT pathway to enhanced EMT, enrichment of CSCs, and tumor progression after ERKi treatment. (A-B) Activation of JAK-STAT signaling after ERKi treatment. A549 and HCC827 cells were treated with BVD or SCH at 2.5 µM for 2 days (A); A549 cells were treated with 2.5 µM BVD and 10 µM Ruxolitinib (Rux) separately or in combination for 2 days (B). Immunoblotting was conducted to determine pSTAT3-Y705. (C-E) Effects of JAK-STAT inhibition on ERKi-induced alteration of miR-204, SPDEF and SNAI2 expression. A549 and HCC827 cells were treated with 2.5 µM BVD and 10 µM Rux, either singly or in combination, for 2 days, mRNA levels of miR-204 (C), SPDEF (D) and SNAI2 (E) were determined using qRT-PCR. (F-H) Effects of JAK-STAT inhibition on ERKi-induced EMT and CSC expansion. A549 cells were treated as in (c, d) for 5 days, the mRNA level of a panel of EMT markers were determined using qRT-PCR (F), the migration ability was determined using the wound healing assay (G), the sphere-forming capacity was determined using the semisolid sphere-formation assay (H). n = 3, bar: SD, **: P < 0.01. (I-L) Effects of JAK-STAT inhibition on tumor progression after ERKi treatment. A549 (I, J) and HCC827 (K, L) cells were injected into nude mice to generate subcutaneous xenografts. Mice were treated with BVD or Rux separately or in combination for 9 days. Tumor growth was continuously monitored for another 6 days. Tumor growth curves during treatment (I, K) and after treatment (J, L) were plotted. a: P < 0.001 vs. Vehicle group; b: P < 0.001 vs Rux group; c: P < 0.05 vs. BVD group; d: P < 0.001 vs Vehicle group; e: P < 0.001 vs BVD group; f: P < 0.05 vs. Rux group (Linear mixed effects models).

