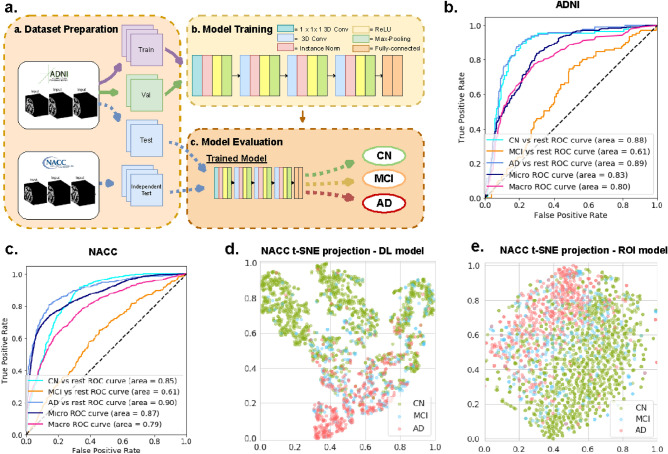
Figure 1.
Overview of the deep learning framework and performance for Alzheimer’s automatic diagnosis. (a) Deep learning framework used for automatic diagnosis. (b) Receiver operating characteristic (ROC) curves for classification of cognitively normal (CN), mild cognitive impairment (MCI) and Alzheimer’s disease (AD), computed on the ADNI held-out test set. (c) ROC curves for classification of cognitively normal (CN), mild cognitive impairment (MCI) and Alzheimer’s disease (AD) on the NACC test set. (d) Visualization using t-SNE projections of the features computed by the proposed deep-learning model. Each point represents a scan. Green, blue, red colors indicate predicted cognitive groups. CN and AD scans are clearly clustered. (e) Visualization using t-SNE projections of the 138 volumes and thickness in the ROI-volume/thickness model. Compared to (d) the separation between CN and AD scans is less marked. The t-SNE approach is described in details in the methods section.

