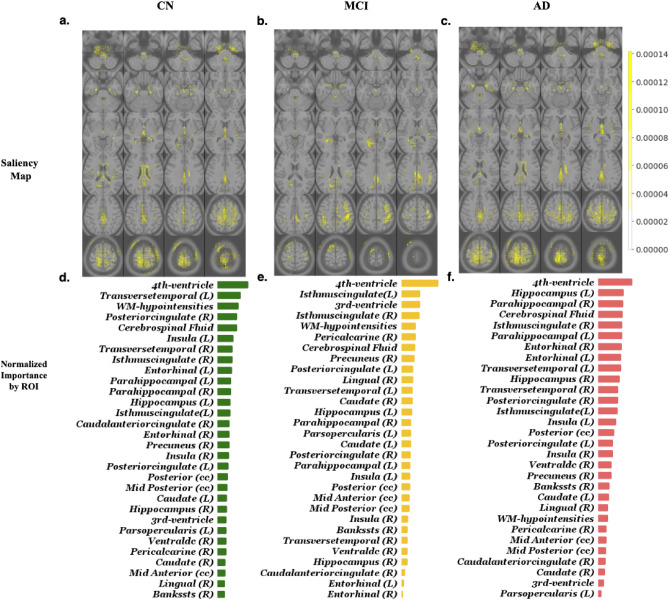
Figure 5.
(a–c) Visualization of the aggregated importance of each voxel (in yellow) in the deep learning model when classifying subjects into CN/MCI/AD. For each subject, the importance map was computed using the gradient of the deep-learning model with respect to its input (Details in “Methods” section). The computed gradients are visualized over the MNI T1-weighted template. (d–f) Top 30 regions of interest, sorted by their normalized gradient count, which quantifies their importance (see “Methods” section), for each of the classes.

