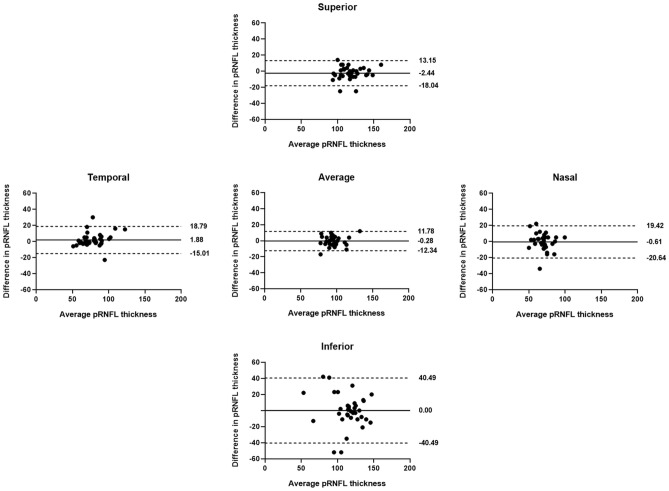
Figure 2.
Bland–Altman plots for the agreement of peripapillary retinal nerve fiber layer (pRNFL) measurements between the two visits in group W. Solid lines represent bias (mean pRNFL thickness difference), and dotted lines represent the upper and lower limits of agreement. Mean bias and upper and lower limits of agreement are shown at the right end of each line. Differences in average and sectoral pRNFL thickness measurements between the visits were greater for group W compared to group N, especially for the inferior pRNFL thickness.

