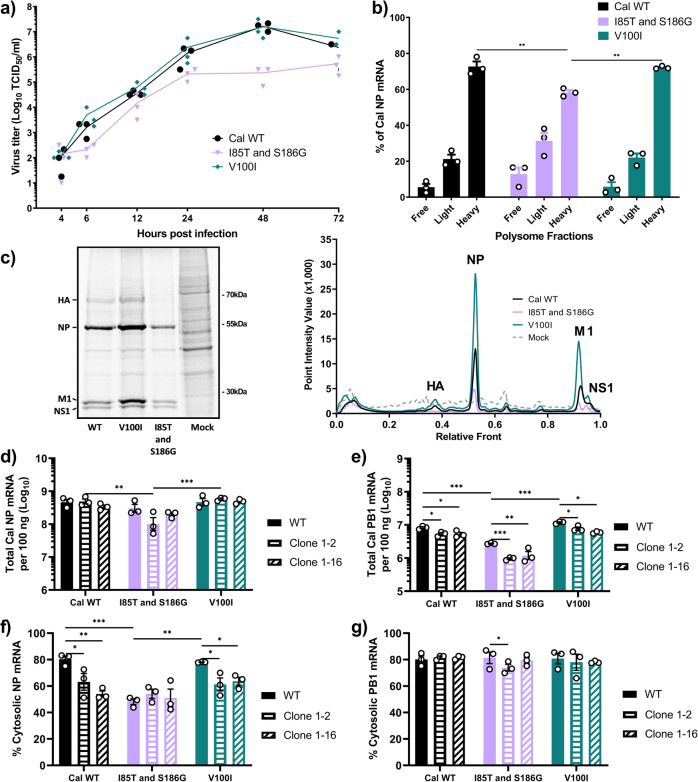
Fig. 8. GRSF1 and adaptive mutations in PA regulate viral growth, cytosolic mRNA levels, and protein expression.
a Calu-3 cells were infected with the indicated viruses at an MOI of 0.01. At indicated times, virus titers in the supernatant were determined. b 293 T cells were infected with the indicated viruses at an MOI of 3 for 1 h. At 4 hpi, cells were lysed and polysome fractionation was performed. NP mRNA in each fraction was quantified by qRT-PCR and fractions are grouped together as in Fig. 1. c A549 cells were infected with the indicated viruses at MOI of 3. At 4.5 hpi, cells were labeled with [35S]Met/Cys for 0.5 h and lysates were resolved by SDS-PAGE. Gel is a representative image from 3 biological replicates. Densitometric traces of labeled proteins from 3 biological replicates were quantified by Quantity One software. d–g 293 T WT or 293 T shRNA GRSF1 clone 1–2 or 1–16 were infected with the indicated viruses at an MOI of 5. At 4.5 hpi, cells were lysed and fractionated into nuclear and cytosolic fractions. d, e Total NP or PB1 mRNA as determined by qRT-PCR and standard a curve. f, g Percent cytosolic NP and PB1 mRNAs as determined by qRT-PCR. Error bars show means plus/minus standard deviations (n = 3 biological replicates). Two-way ANOVA followed by Tukey’s multiple comparison test *P < 0.05, **P < 0.01, ***P < 0.001.

