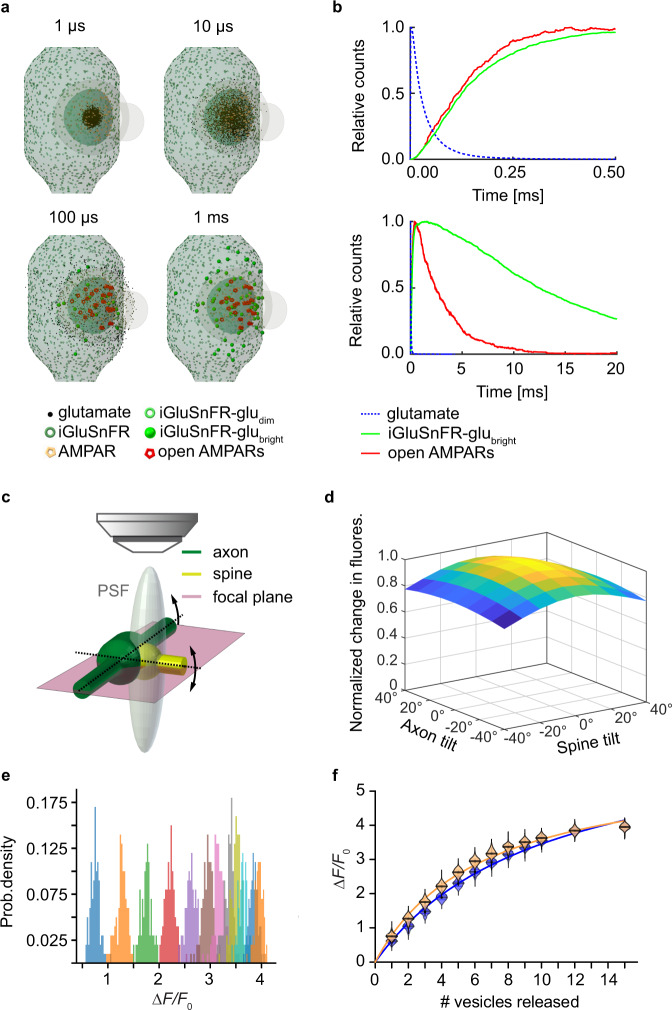
Fig. 5. Monte-Carlo-simulation of glutamate diffusion in the synaptic cleft.
a Simulated glutamate dynamics after release of a single vesicle. The model consists of a presynaptic terminal with iGluSnFR molecules opposed to a spine with AMPARs randomly distributed in a disc of 300 nm, separated by a 20-nm synaptic cleft. The synapse is embedded in a network of astrocytes equipped with glutamate transporters (not shown). b Kinetics of AMPAR opening and iGluSnFR entering the bright fluorescent state upon release of a single vesicle containing 3000 molecules of glutamate (upper panel) and expanded time scale (lower panel). c Model geometry including the point spread function (PSF) of the microscope. Different orientations of axon and spine with respect to the optical axis were evaluated. d Tilting the axon or the spine reduces ΔF/F0, as more iGluSnFR molecules outside the synaptic cleft fall within the PSF, contributing to the resting fluorescence F0. e Histogram of peak iGluSnFR (ΔF/F0) after simultaneous release of a specific number of vesicles (1–15 vesicles, 100 runs each, 3000 glutamate molecules per vesicle). f Summary of release simulations at optimal cleft orientation (orange violins) and with 40° spine tilt (blue violins). Curves are hyperbolic functions (least squares fit). Source data are provided as a Source Data file.

