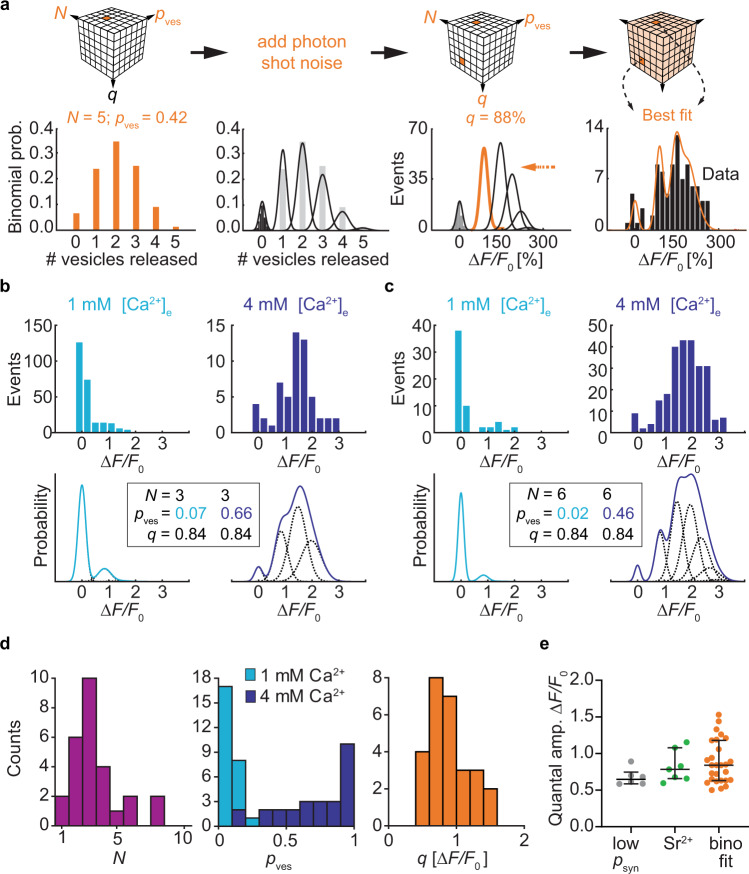
Fig. 6. Extracting N, pves, and q of Schaffer collateral synapses using a binomial model.
a Extracting quantal parameters by exhaustive search. For every combination of N and pves, the binomial probabilities of the possible outcomes were calculated (here: N = 5 vesicles and pves = 0.42). Without stimulation, amplitudes were normally distributed around zero (black histogram). The width of this noise distribution was used to determine the width of the expected Gaussian probability density functions. A chosen quantal amplitude q (here: 88% ΔF/F0) and iGluSnFR saturation function (Bmax = 6 ΔF/F0, orange arrow) sets the spacing of the Gaussians. The resulting probability density function (sum of the Gaussians) was compared to the measured amplitude distribution (black bars, recorded in 2 mM [Ca2+]e). The root mean square (RMS) error was calculated and the best fit (shown here) was selected. b, c Single bouton response distributions recorded in 1 mM [Ca2+]e and 4 mM [Ca2+]e. Two examples from two different slice cultures. The binomial fitting procedure was applied to both histograms, searching for the best combined fit under the condition that N and q had to be identical in 1 mM [Ca2+]e and 4 mM [Ca2+]e while pves could be different. Best fit probability density functions and extracted parameters are shown below the experimental data. d Extracted quantal parameters, N median: 3 vesicles, IQR: 2–4 vesicles; pves in 1 mM [Ca2+]e median: 0.08, IQR: 0.04–0.12; pves in 4 mM [Ca2+]e median: 0.79, IQR = 0.55–0.94; q median = 0.84 ΔF/F0, IQR: 0.63–1.18 ΔF/F0, n = 27 boutons. e Estimating quantal amplitude by three different approaches using independent datasets. Comparing the three approaches, the estimated values of q were not significantly different (Kruskal–Wallis test, p = 0.22). psyn < 0.5 boutons in 2 mM [Ca2+]e median: 0.65 ΔF/F0, IQR: 0.59-0.75 ΔF/F0, n = 6 boutons; delayed events in 4 mM [Sr2+]e wash-in experiments median: 0.78 ΔF/F0, IQR: 0.66-1.08 ΔF/F0, n = 7 boutons; binomial fitting procedure median: 0.84 ΔF/F0, IQR: 0.63-1.18 ΔF/F0, n = 27 boutons. Values are given as median with IQR. Source data are provided as a Source Data file.

