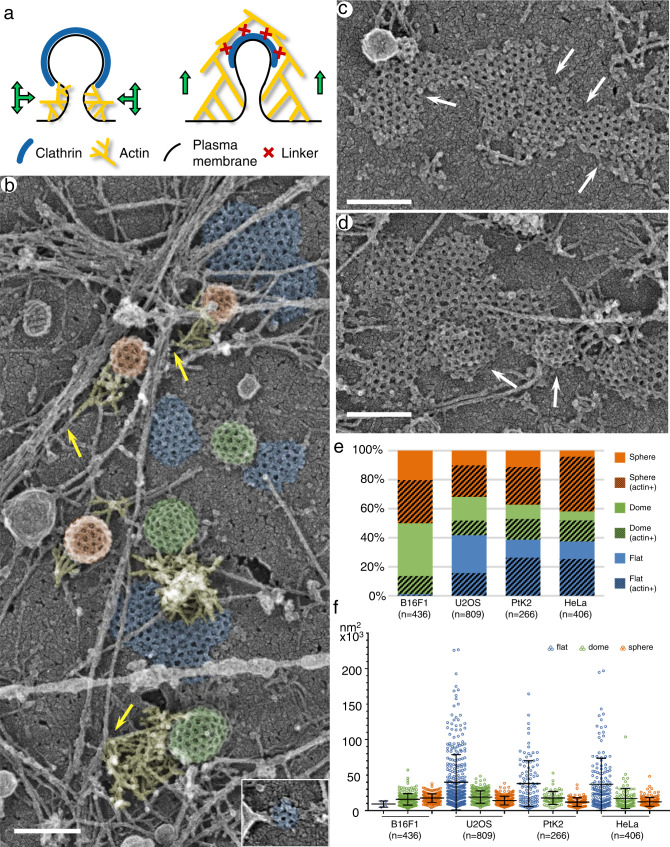
Fig. 1. PREM analysis of CCS morphology.
a Two alternative models for actin-dependent invagination of CCSs. (Left) Edge pushing model. (Right) Apical pulling model. b A region of an unroofed U2OS cell showing flat (blue), dome-shaped (green) and spherical (orange) CCSs, some of which associate with branched actin networks (yellow). Arrows mark linear actin filaments from which branched networks originate. Inset shows a very small flat CCS. c Large flat CCSs in U2OS cells contain subdomains demarcated by “seams” (arrows) with disrupted polygonal clathrin pattern. d Dome-shaped subdomains (arrows) within a large mostly flat CCS in U2OS cells. e Percentages of different CCS shape categories in four different cells types. Hatched colors indicate a fraction of actin-associated CCSs within a given category. f Projection area of CCSs of different shape categories in indicated cell types. Error bars, mean ± SD. Scale bars, 200 nm.

