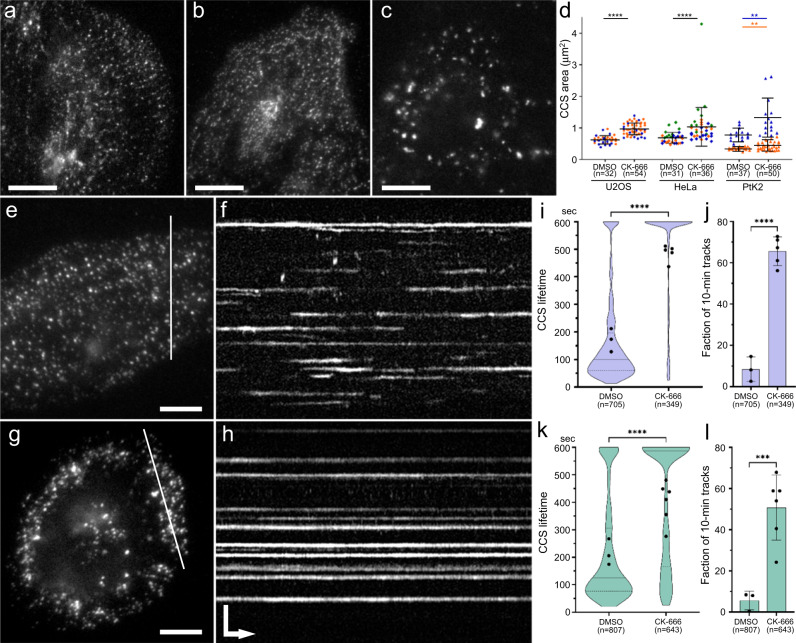
Fig. 4. Inhibition of the Arp2/3 complex leads to enlargement and stabilization of CCSs in intact cells.
a–c TIRF microscopy images of RFP-CLC in U2OS cells cultured in the presence of 10% FBS (a), or incubated overnight in a medium containing 0.1% FBS and supplemented for the last 4 h with either DMSO (b) or 200 μM CK-666 (c). d Quantification of the CCS area in TIRF microscopy images of the indicated cell types treated with either DMSO or 200 μM CK-666, as described for b and c. Individual experiments are color-coded. CCSs were visualized using endogenously tagged RFP-CLC (U2OS and HeLa cells) or by immunostaining of CHC (PtK2 cells; individual experiments were statistically evaluated separately due to different staining intensities). Error bars, mean ± SD; ****p < 0.0001; **p = 0.0049 (blue) or 0.0043 (orange); (unpaired two-tailed t test with Welch’s correction); n, number of cells. e, g First frames of 10-min long TIRF microscopy time-lapse sequences of RFP-CLC in U2OS cells treated with either DMSO (e) or CK-666 (g) as explained for b and c. f, h Kymographs along lines in e and g, respectively. i–l Quantification of CCS dynamics showing CCS lifetimes (i, k) and fractions of 600-sec long traces (j, l) in U2OS (i, j) and HeLa (k, l) cells treated with DMSO or CK-666. Solid and dashed lines in violin plots (i, k) indicate median and quartiles, respectively. For CK-666-treated U2OS cells, the lines are not visible, because the median and the 75% quartile are equal to 600 s and 25% quartile is 504 s. Error bars in j and l represent mean ± SD. Black dots in i–l indicate average values per cell. ****p < 0.0001; ***p = 0.0005 (unpaired two-tailed t test with Welch’s correction). Scale bars, 20 μm (a–c) and 10 μm (e, g). For both f and h, vertical bar in h is 5 μm, and horizontal arrow is 60 s.

