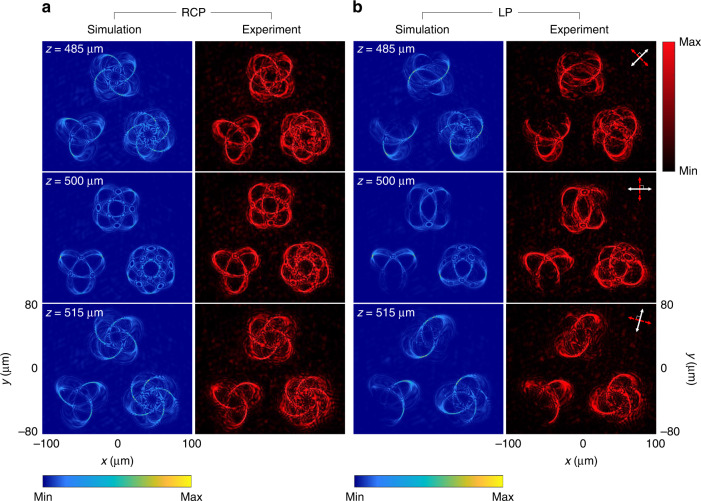
Fig. 3. Simulation and experimental results of the generated multiple 3D polarization knots at λ = 650 nm.
a The intensity distributions at different observation planes under the illumination of RCP light beam. b The intensity distributions under the illumination of an LP light beam for polarization distribution detection with different transmission axes of the linear polarizer and the analyzer at different observation planes. The simulated (left) and measured intensity profiles (right) at three observation planes after passing through the analyzer by considering Malus’ law with different combinations of the transmission axes of the polarizer and the analyzer. The white and red double arrows indicate the transmission axes of the first polarizer (P1) and the analyzer (P2), respectively. P1⊥P2. The direction of the white arrows: 45° (z = 485 μm), 0° (z = 500 μm), and 75° (z = 515 μm) w.r.t. the x axis

