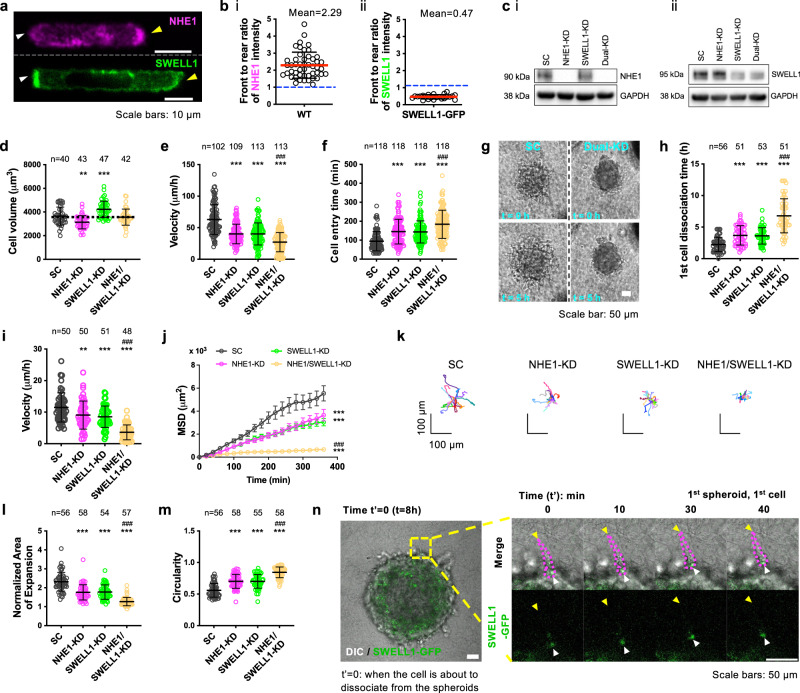
Fig. 1. Distinct spatial localization patterns of NHE1 and SWELL1, and their roles in cell volume regulation and confined migration.
a, Top: Image of a cell stained for NHE1 showing preferential localization at the leading edge (yellow arrowhead). Bottom: Image of another cell showing intense localization of SWELL1-GFP at the cell rear (white arrowhead). b Front to rear ratio of (i) endogenous NHE1 (n = 48) or (ii) SWELL1-GFP intensity (n = 23) in confined cells. Data represent mean ± SD from four independent experiments. c Western blots of cells transduced with SC or shRNA sequences against NHE1 and/or SWELL1. GAPDH served as a loading control. Uncropped blots in Source Data. d Effects of NHE1 and/or SWELL1 knockdown on cell volume inside confining channels. Data represent mean ± SD for cells analyzed from three independent experiments. e, f Effects of NHE1 and/or SWELL1 knockdown on e migration velocity and f cell entry time in confining channels. Data represent mean ± SD for cells analyzed from 3 independent experiments. g Images showing dissemination of SC and dual NHE1- and SWELL1-KD cells from spheroids embedded in 3D collagen gels at t = 0 and 5 h. h–k Effects of NHE1 and/or SWELL1 knockdown on h the time for the first cell to dissociate from spheroids, and the i migration velocity, j mean squared displacement, and k trajectories of disseminated cells in 3D. Data represent mean ± SD for cells analyzed from three independent experiments. l, m Effects of NHE1 and/or SWELL1 knockdown on l normalized area of expansion at t = 12 h relative to t = 0 and m circularity of the spheroids at t = 0 embedded in 3D collagen gels. Data represent mean ± SD for cells analyzed from three independent experiments. n Time-lapse montage of a SWELL1-GFP-tagged cell (outlined by dashed magenta lines) dissociating from a spheroid embedded in collagen. White arrowheads denote SWELL1 polarization at the cell rear. Yellow arrowheads indicate the cell leading edge. **p < 0.01 and ***p < 0.001 relative to SC, ###p < 0.001 relative to either of single KD cells. Tests performed: d, e, h, i, m one-way ANOVA followed by Tukey’s post hoc test, f, l Kruskal–Wallis followed by Dunn’s, or j two-way ANOVA followed by Tukey’s. The number of cells analyzed is indicated in each panel. Cell model: MDA-MB-231.

