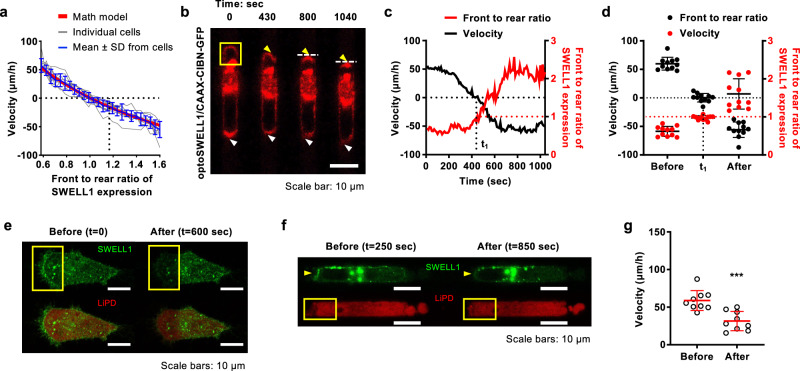
Fig. 2. SWELL1 polarization controls cell migration direction and efficiency.
a A multi-phase, steady-state mathematical model (shown in red), which accounts for actin-cytosol (water)-ions-coupled cell migration, was compared to experimental measurements from 11 individual cells subjected to optogenetic stimulation (shown in gray). Cells were obtained from three independent experiments. The model predicts that SWELL1 enrichment at the cell rear controls migration direction and velocity, which is in line with the mean ± SD of the experimental data (shown in blue). b Time-lapse montage of a representative MDA-MB-231 cell expressing OptoSWELL1 and CAAX-CIBN-GFP following light stimulation at the cell leading edge in a region enclosed by the yellow box. Gradual SWELL1 accumulation at the cell front (yellow arrowhead) is accompanied by reduction at the cell rear (white arrowhead). White dash lines denote the “new” trailing edge. c Instantaneous migration velocity (black line) and front to rear ratio of SWELL1 intensity (red line) of the cell shown in b. At t = 430 sec (t1), SWELL1 is equally distributed at both cell poles and its motility ceases. Further SWELL1 enrichment at the cell front results in reversal of migration direction as depicted by negative velocity values. d Migration velocity (black dots) and front to rear ratio of SWELL1 fluorescence intensity (red dots) of cells before optogenetic stimulation, at t = t1 and t ≥ 1000 sec after stimulation. Data represent the mean ± SD for 11 cells from 3 independent experiments, also shown in a. e, f Montage of cells expressing SWELL1-GFP and LiPD system e on 2D and f inside confining channels. Merged images of SWELL1-GFP and LiPD system are shown in the lower panels (e). Light stimulation was applied in a region enclosed by yellow boxes just after e t = 0 or f t = 250 sec. Light-induced SWELL1 degradation is observed after 600 sec. g Migration velocity of cells expressing SWELL1-GFP and LiPD system before and after light stimulation. Data represent the mean ± SD for 9 cells from 4 independent experiments. ***p < 0.001 relative to before light stimulation. Significance was determined using two-tailed paired t-test.

