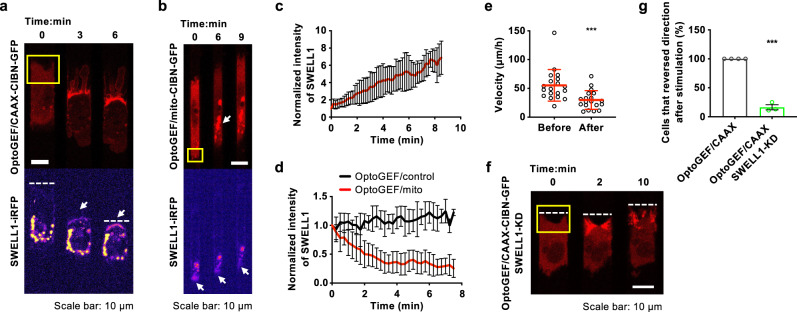
Fig. 4. RhoA activity regulates SWELL1 polarization.
a, b Time-lapse montage of MDA-MB-231 cells expressing SWELL1-iRFP, OptoGEF-RhoA, and a CAAX-CIBN-GFP or b mito-CIBN-GFP inside a 10 μm- or b 3 μm-wide channels. Light stimulation was applied in a region enclosed by yellow boxes just after t = 0. a OptoGEF-RhoA enrichment at the cell front is accompanied by local SWELL1 accumulation (white arrow), which causes migration direction reversal. The position of the cell’s “old” leading edge is depicted by white dash lines in a. b Optogenetic downregulation of RhoA activity at the cell rear is accompanied by Rho-GEF accumulation in mitochondria (white arrow, top), and a reduction of SWELL1 intensity at the cell rear (white arrow, bottom). c Normalized SWELL1-iRFP intensity at the “old” cell front (or “new” cell rear) after optogenetically stimulating cells with optoGEF-RhoA and CAAX-CIBN-GFP. Data represent the mean ± SD for n = 23 cells from 5 independent experiments. d Normalized SWELL1-iRFP intensity at cell rear after stimulating optoGEF-RhoA in the presence (red) or absence (black; control) of mito-CIBN-GFP. Data represent the mean ± SD for n = 25 cells (red) and n = 9 cells (black) from 6 independent experiments. e Migration velocity of MDA-MB-231 cells expressing OptoGEF-RhoA, mito-CIBNGFP and SWELL1-iRFP before and after light stimulation. Data represent the mean ± SD for n = 19 cells from 6 independent experiments. f Time-lapse montage of a SWELL1-KD MDA-MB-231 cell expressing OptoGEF-RhoA and CAAX-CIBN-GFP. The cell’s leading edge during migration inside 10 μm-wide channels is indicated by a dashed white line at the indicated times. Light-induced upregulation of RhoA activity occurred in a region enclosed by the yellow box just after t = 0 min. SWELL1-KD cell fails to reverse its migration direction following RhoA activation at its leading edge. g Effect of SWELL1-KD on the percentage of cells that reverse migration direction after optogenetic RhoA activation at cell leading edge. Data represent the mean ± SEM from 4 (control) or 3 (SWELL1-KD) independent experiments with n = 28 (control) or n = 25 cells (SWELL1-KD) analyzed in total. ***p < 0.001 relative to e before stimulation or g control data assessed by e paired or g unpaired two-tailed t-test.

