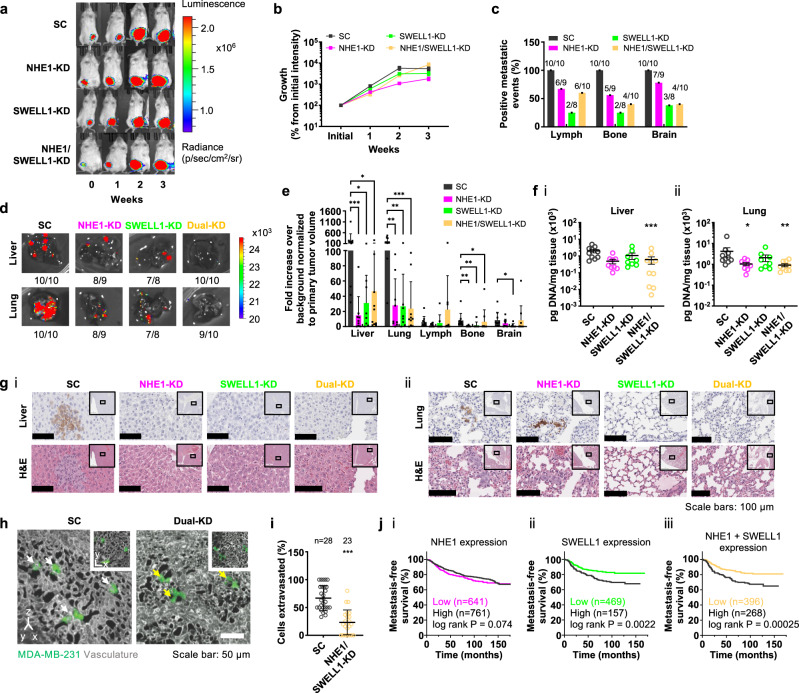
Fig. 6. Dual NHE1 and SWELL1 knockdown blocks breast cancer cell extravasation and metastasis.
a, b Bioluminescent images of mice following subcutaneous injection of SC, single NHE1-KD or SWELL1-KD, or dual-KD cells into the mammary gland. Data represent mean ± SEM from 10 mice per group at the indicated timepoints, except for SWELL1-KD (n = 9 at week 2; n = 8 at week 3). c Percentage of mice with positive metastatic events in the lymph node, bone and brain for the indicated number of mice. One mouse in a, b died before imaging for metastasis (n = 9 for NHE1-KD). d Bioluminescent images of the liver and lung of mice at endpoint. e Quantification of bioluminescent signal from liver, lung, lymph nodes, bone, and brain. Data represent mean ± SD for the same number of mice shown in c, except for one extreme outlier in the lymph nodes of a mouse injected with dual-KD cells. f Amount of human DNA in the (i) liver or (ii) lung of mice at endpoint as determined by qPCR. Data represent mean ± SEM for the same number of mice shown in c. g Representative 10× images of adjacent (i) liver or (ii) lung sections immunostained for GFP or hematoxylin and eosin (H&E). Insets show the surrounding area at 2×, and indicate the area displayed at 10×. h 3D reconstructions of CAM vasculature with extravasating cells engineered to express either SC or dual NHE1 and SWELL1-KD. White arrows indicate extravasated cells; yellow arrows denote cells that are still located within the vasculature. Insets show single optical planes of the same fields of view. i Quantification of cell extravasation. Data represent the mean ± SD for the indicated number of cells from three independent experiments. j Kaplan–Meier analysis of NHE1 expression (i), SWELL1 expression (ii), NHE1 and SWELL1 expression (iii) and distant metastasis-free survival for breast cancer patients. *p < 0.05, **p < 0.01, and ***p < 0.001 relative to SC (e, f, i) assessed by e Kruskal–Wallis followed by Dunn’s test or f one-way ANOVA followed by Tukey’s test after log transformation or i two-tailed unpaired Mann–Whitney test. Significance in j was computed using the Cox–Mantel (log rank) test as provided by KM-plotter. Cell model: MDA-MB-231.

