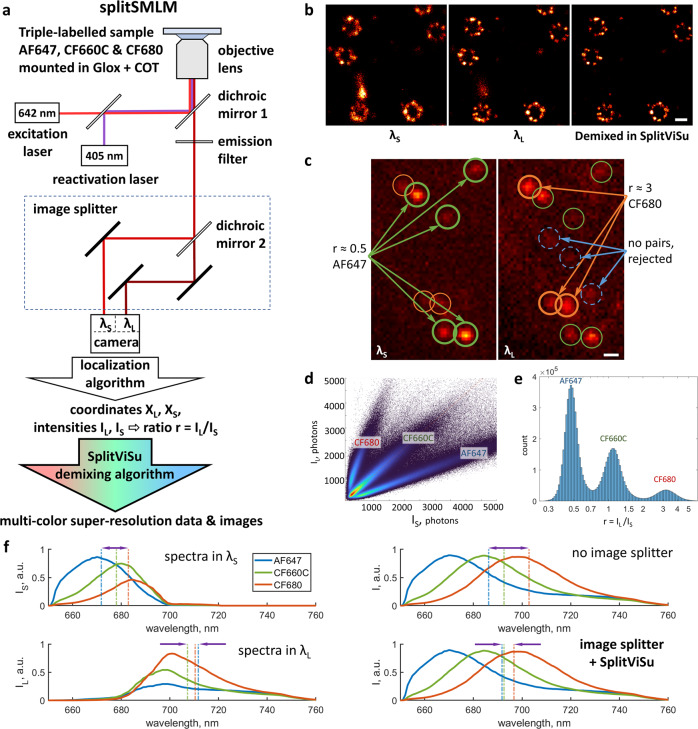
Fig. 1. Principle of splitSMLM.
a Scheme of the splitSMLM imaging system and the overall workflow. b Super-resolution images of a single-labeled sample, reconstructed (from left to right) from localizations within the λS channel, from localizations within the λL channel or after demixing in SplitViSu, demonstrating removal of spurious localizations and resolution improvement. c Image of the two spectrally different channels, λS and λL (left and right, respectively), with localizations originating either from AF647 (green), CF680 (orange) or from background noise (blue). d Bivariate histogram of photon counts IS and IL originating from the λS and λL channels with three sectors corresponding to three fluorophore species. e Univariate histogram of ratios r on a semi-log plot with three peaks corresponding to three fluorophore species. f Fluorescence spectra of AF647, CF660C and CF680 calculated within the λS and λL channels (left), without image splitter (top right), or equivalent spectra after demixing in SplitViSu (bottom right). Vertical lines represent average wavelengths for the corresponding fluorophores in the corresponding channels. Average wavelengths after demixing in SplitViSu are calculated as the mean values of the average wavelengths of the fluorophores in the λS and λL channels. Arrows indicate maximum spectral difference within the triplet of fluorophores and reflect the amount of chromatic aberrations in the corresponding setting. Scale bars, 100 nm (b) and 500 nm (c).

