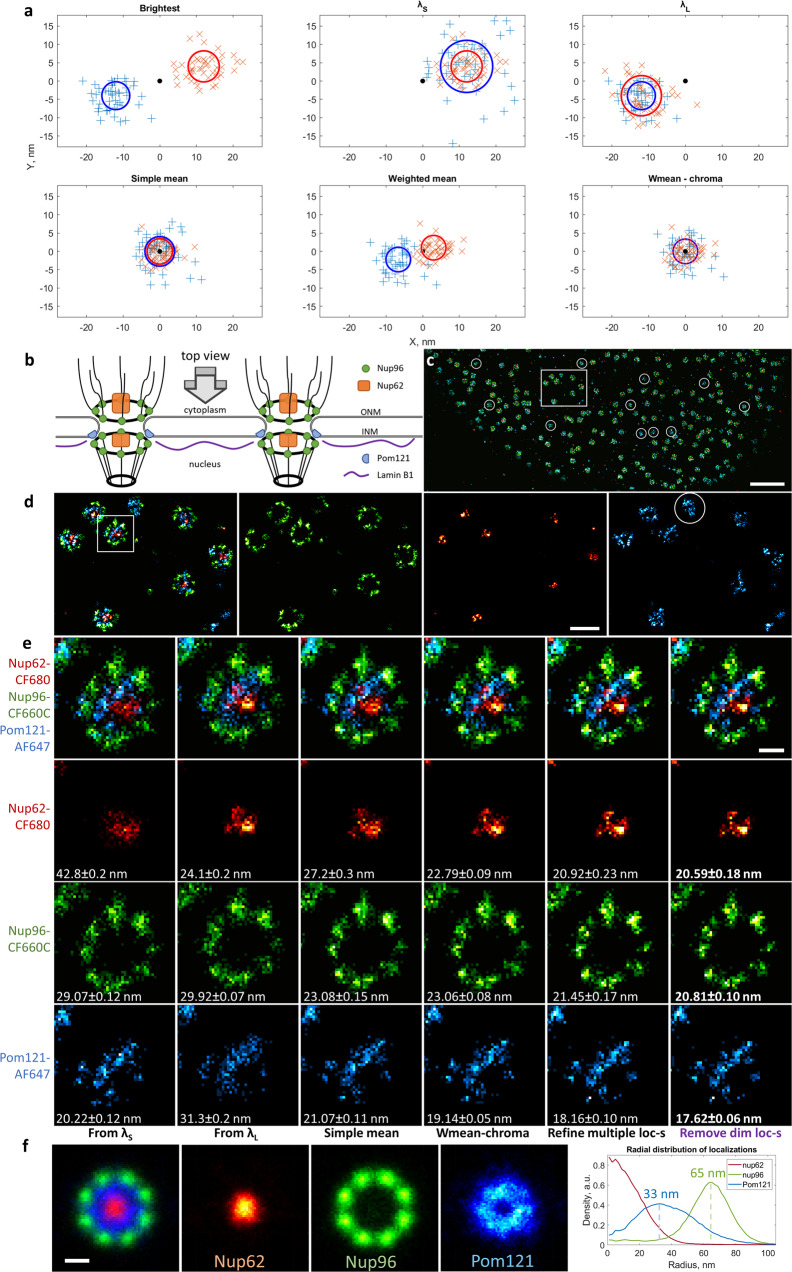
Fig. 2. Localization precision and chromatic error correction in splitSMLM using SplitViSu.
a Simulated results of demixing in SplitViSu using various methods for calculation of the output coordinates: “brightest”—the output coordinates equal the input coordinates from the brightest channel for the given fluorophore; “λS”, “λL”—the output coordinates equal the input coordinates from the λS or λL channel, respectively; “simple mean”—the output is calculated as a simple mean of the input coordinates in the λS and λL channels; “weighted mean”—the output is calculated as a photon count-weighted mean of the input coordinates in the λS and λL channels; “wmean-chroma”—the output is calculated as the “weighted mean” with subsequent subtraction of a chromatic error. The simulated data contains two species of fluorophores with different ratios: rred = 0.6, rblue = 3.5. The true position is the same for both fluorophore species and is shown as a black dot. The total photon count detected from every localization is the same for all fluorophores and equals 2000 photons. The full width at half maximum (FWHM) of the microscope’s PSF is 300 nm. The chromatic error between two fluorophores within the opposite channels of the image splitter is 24 nm (x-direction) and 8 nm (y-direction). Each species was detected 50 times within each channel. The circles represent the FWHM of the demixed distributions using the corresponding method for calculation of the output coordinates. b Scheme of the NPCs at the NE, used as a test object in this study. ONM, outer nuclear membrane; INM, inner nuclear membrane. c–e “Top views” of the NPCs in a U2OS cell with immunofluorescently labeled Pom121 (blue), Nup62 (red) and Nup96 (green). Rectangle in c represents the region zoomed in d; square in d represents the region zoomed in e. Circles in c and e represent Pom121 clusters with few localizations of Nup96 and Nup62, which might correspond to deposition sites of new NPCs. e Different methods for calculation of demixed coordinates tested on a single NPC. Numbers in the bottom represent the resolution of the images, estimated according to the FRC1/7 criterion33, calculated from the images of a whole cell. The images in e are reconstructed as 2D histograms of localization coordinates with a pixel size of 5 × 5 nm. f Sum of aligned images of individual NPCs with a radial distribution of localizations of each protein shown in the graph. For this graph, a sum of 160 NPC particles was used. Scale bars, 1 µm (c), 200 nm (d), 50 nm (e, f).

