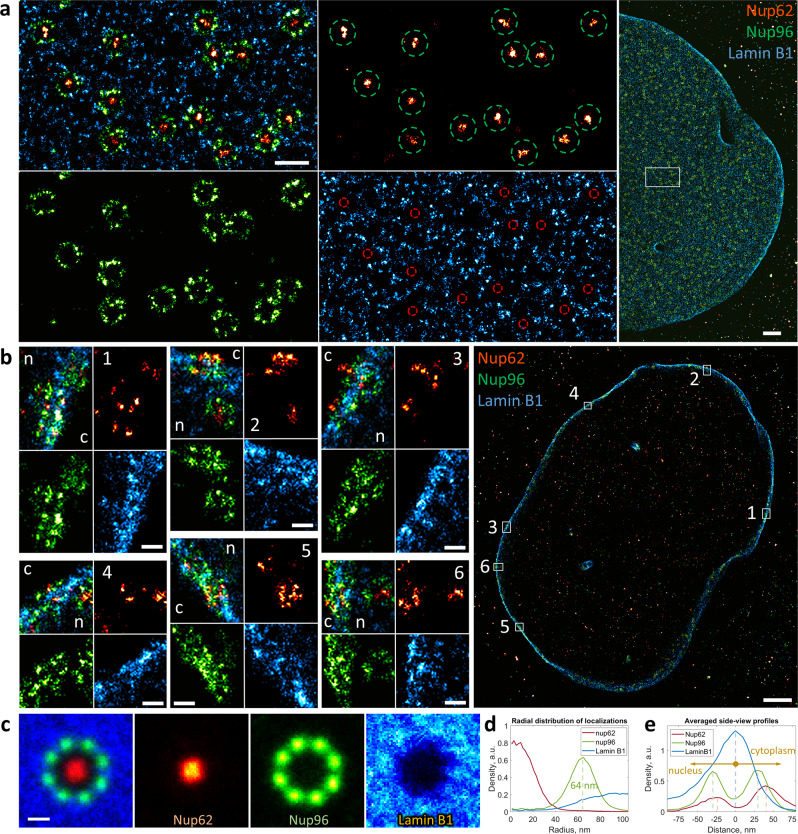
Fig. 4. Three-color splitSMLM imaging of lamin B1 at the NE.
a “Top view” of the NE (Nup96, green; Nup62, red; lamin B1, blue). Green circles with a diameter of 150 nm represent the positions of the Nup96 ring. Red circles have a diameter of 50 nm and represent the positions of Nup62. White rectangle indicates the zoomed-in region. b “Side views” of the NE. The numbered rectangles in the general view represent the zoomed-in regions; n, nucleus; c, cytoplasm. c Sum of aligned images of individual NPCs. d Radial distribution of localizations of each protein obtained by averaging 99 NPC particles. e Averaged “side view” profiles of Nup62, Nup96 and lamin B1 obtained by alignment of 66 individual NPCs. Scale bars, 200 nm (a, left), 1 µm (a, right and b, right), 100 nm (b, left), 50 nm (c).

