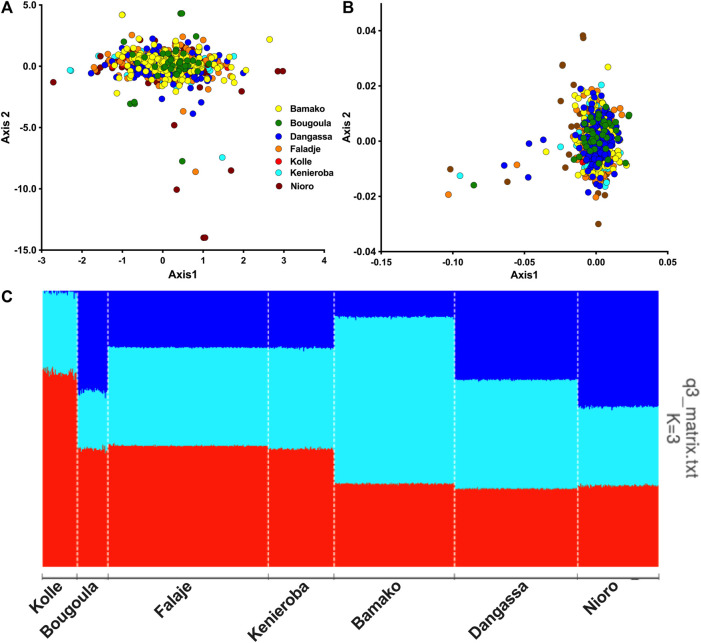
FIGURE 2.
Population structure and ancestry of P. falciparum from Mali. (A) Plot of the first two components (Axis1 vs. Axis2) of principal component analysis (PCA) using genotype data from samples in Mali. (B) Scatter plot of first two dimensions of multidimensional scaling (MDS) of identity by state between pairs of isolates. Each point represents an isolate, color-coded by sites of sampling. (C) Barplot of ancestry proportions per sample and site of collection shown on the x-axis. Each ancestral population is indicated by a different color, (K1 (red), K2 (turquoise), and K3(blue)) and each vertical bar represents a single sample, colored according to the estimated ancestry proportions.

