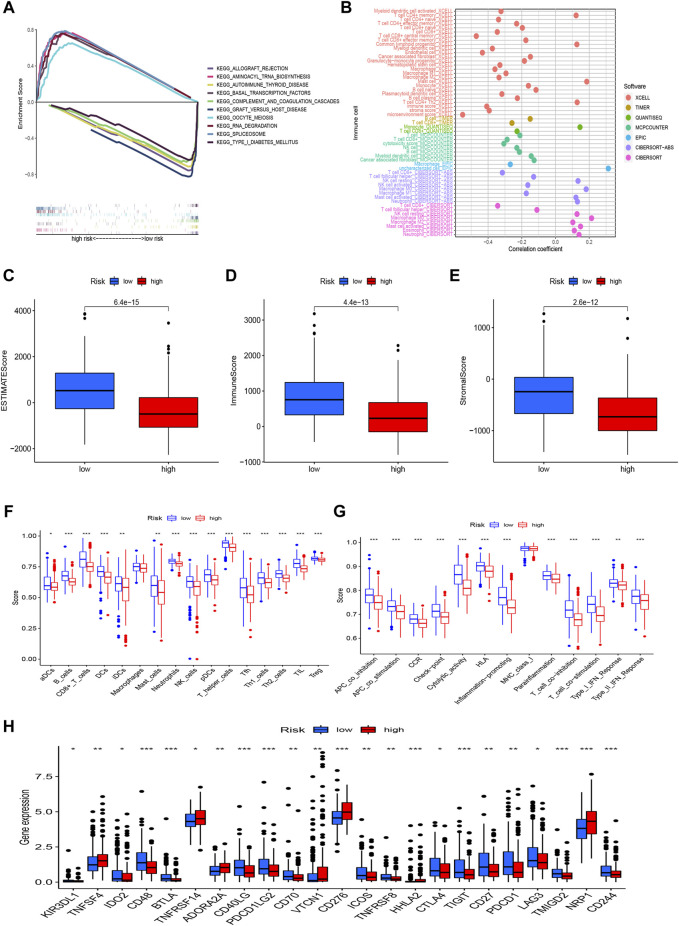
FIGURE 6.
The differences of tumor immune microenvironment between the low-risk and high-risk groups. (A) GSEA of the top 10 pathways significantly enriched in the risk groups; (B) The immune cell bubble of risk groups; (C–E) The boxplots of the comparison of StromalScore, ImmuneScore, and ESTIMATEScore, respectively, between low- and high-risk groups; (F,G) The ssGSEA scores of immune cells and immune functions in the risk groups; (H) The difference of common immune checkpoint expression in the risk groups. *p < 0.05, **p < 0.01, ***p < 0.001.

