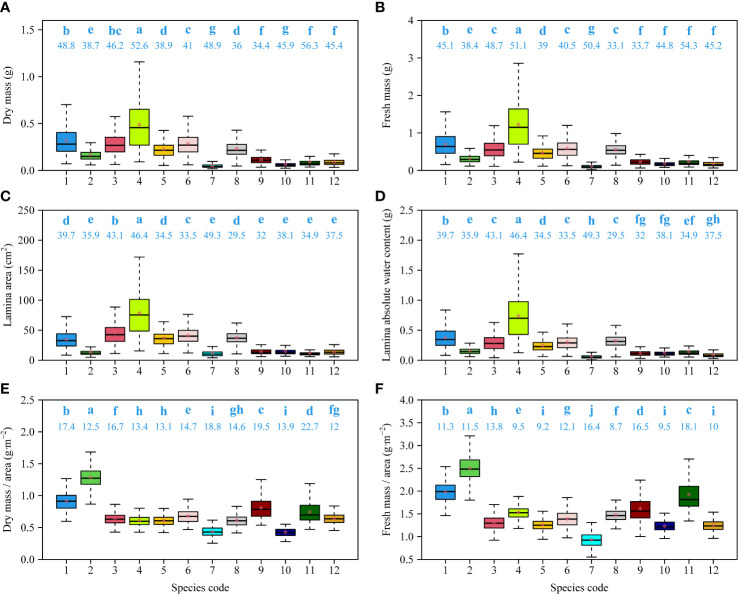
Figure 4.
Comparisons of dry mass (A), fresh mass (B), lamina area (C), lamina absolute water content (D), ratio of fresh mass to area (E), and ratio of dry mass and area (F) among 12 species. The letters on the top of the whiskers of the boxes signify the significance of the difference between any two of 12 species; the numbers on the top of the whiskers of the boxes signify the coefficients of variation of leaf measures; the solid segments and asterisks within the boxes represent the medians and means of each leaf measure based on 3000 bootstrapping replications, respectively. Species codes associated with their binomials are the same as those in Table 1 .

