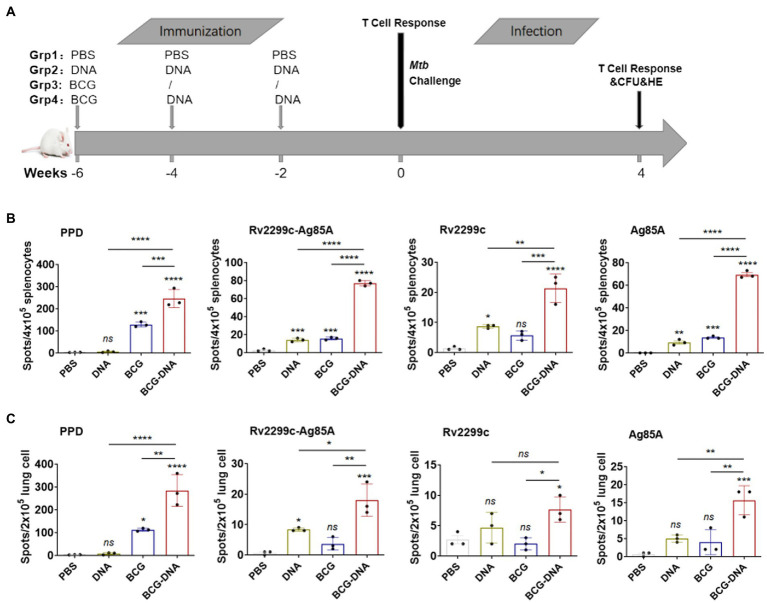
Figure 2.
ELISPOT assay of antigen-specific IFN-γ-production by T cells from immunized mice prior to infection. (A) Vaccination and infection schedule. At 6 weeks after the primary immunization, cells from spleens (B) or lungs (C) of immunized mice (n = 3) were isolated and incubated with PPD, Rv2299c, Ag85A or Rv2299c-Ag85A protein for ex vivo IFN-γ ELISPOT assays. Representative responses revealed by Elispot assays and quantified are shown as spot-forming units (n = 3 mice, one-way ANOVA, mean ± SEM). *p < 0.05, **p < 0.01, ***p < 0.001, ****p < 0.0001: a significant difference of treatment groups from the appropriate controls (PBS group). ns, no significant difference.

