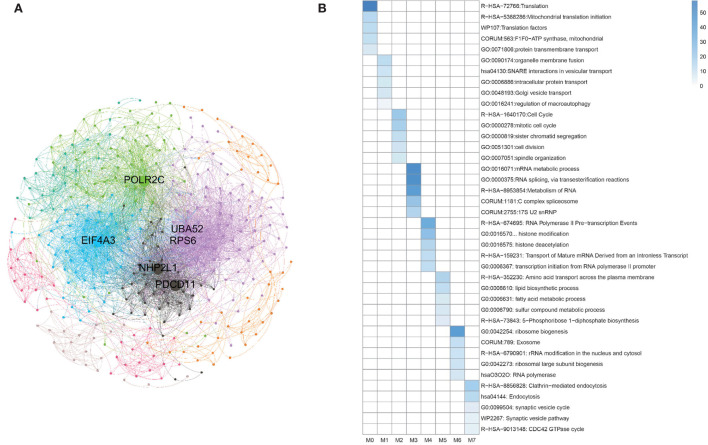
Figure 9.
Clustering analysis for matched homologous genes in human. (A) Topological organization for eight modular sub-networks marked with different colors. (B) Enrichment biological functions of pan-cancer sub-networks. Each row represents a GO BP term and each column corresponds to a pan-cancer sub-network for each subnetwork.

