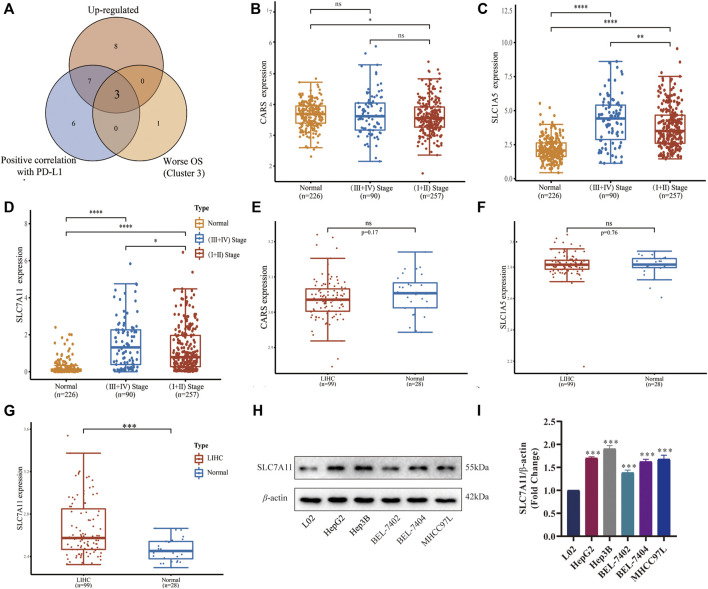
FIGURE 4.
Expression and verification of a key ferroptosis regulator SLC7A11 in LIHC. (A) Venn diagram identified three upregulated FRGs associated with PD-L1 and worse prognoses. (B–D) Differential expression of CARS, SLC1A5, and SLC7A11 in different stages of tumor group and normal group in GSE60502. (E–G) Differential expression of CARS, SLC1A5, and SLC7A11 in the tumor group and normal group in GSE62232. (H) The expressions of SLC7A11 in different cell lines were detected by Western blot (n = 3). (I) Histogram of differential SLC7A11 expression on five LIHC cell lines. *p < 0.05, **p < 0.01, ***p < 0.001 and ****p < 0.0001.

