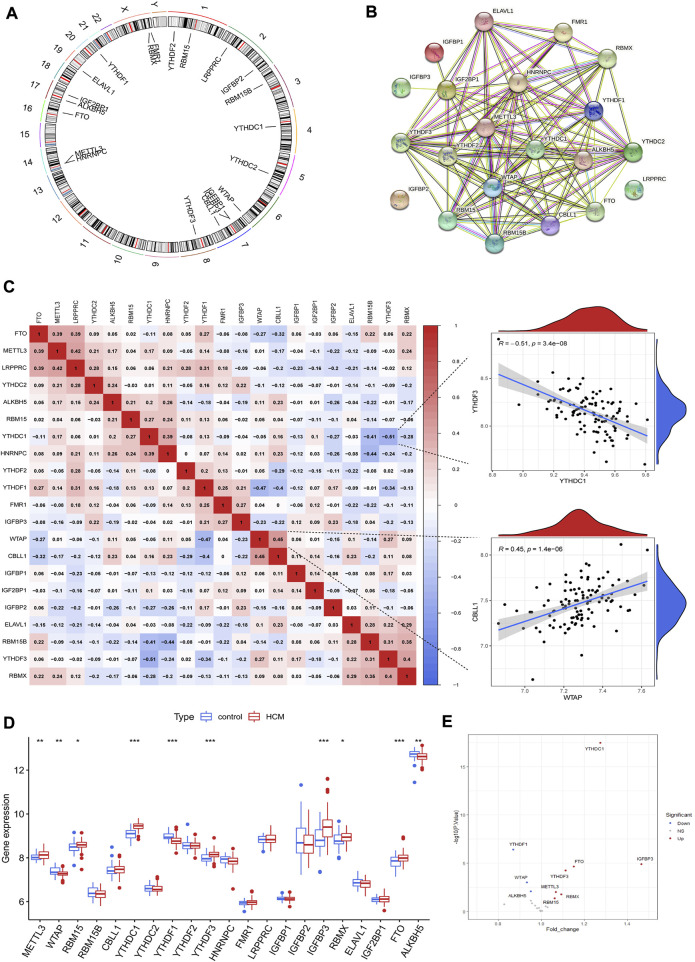
FIGURE 2.
The landscape of m6A regulators in hypertrophic cardiomyopathy (HCM) patients. (A) Chromosomal positions of the 21 m6A regulators identified in cardiac tissues of HCM. (B) Protein-protein interaction network of the m6A regulators. (C) Spearman correlation analysis between the 21 m6A regulators in HCM and the scatterplots showing the two pairs of m6A regulators with the highest positive and negative correlation. (D) Box plot demonstrating the differential expression of 21 m6A regulators between HCM and non-HCM using Wilcox rank sum test. (E) Volcano plot showing a summary of the 10 differentially expressed m6A regulators. *p < 0.05, **p < 0.01, ***p < 0.001.

