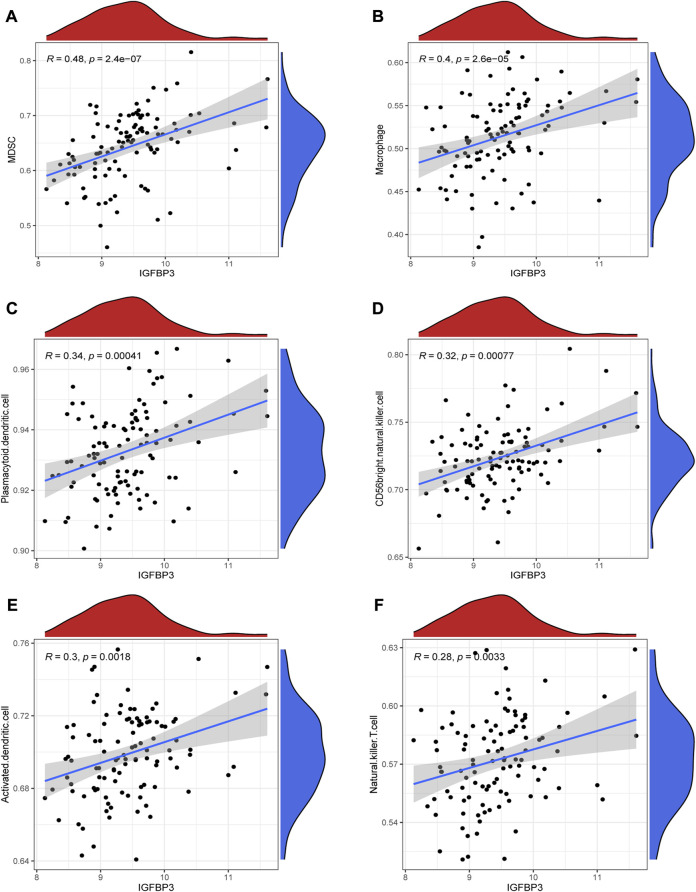
FIGURE 6.
Correlation between IGFBP3 and immune cells in hypertrophic myocardiopathy (HCM) using spearman correlation analysis. (A) Correlation between IGFBP3 and MDSC. (B) Correlation between IGFBP3 and macrophage. (C) Correlation between IGFBP3 with plasmacytoid dendritic cell. (D) Correlation between IGFBP3 with CD56 bright natural killer cell. (E) Correlation between IGFBP3 with activated dendritic cell. (F) Correlation between IGFBP3 with natural killer T cell.

