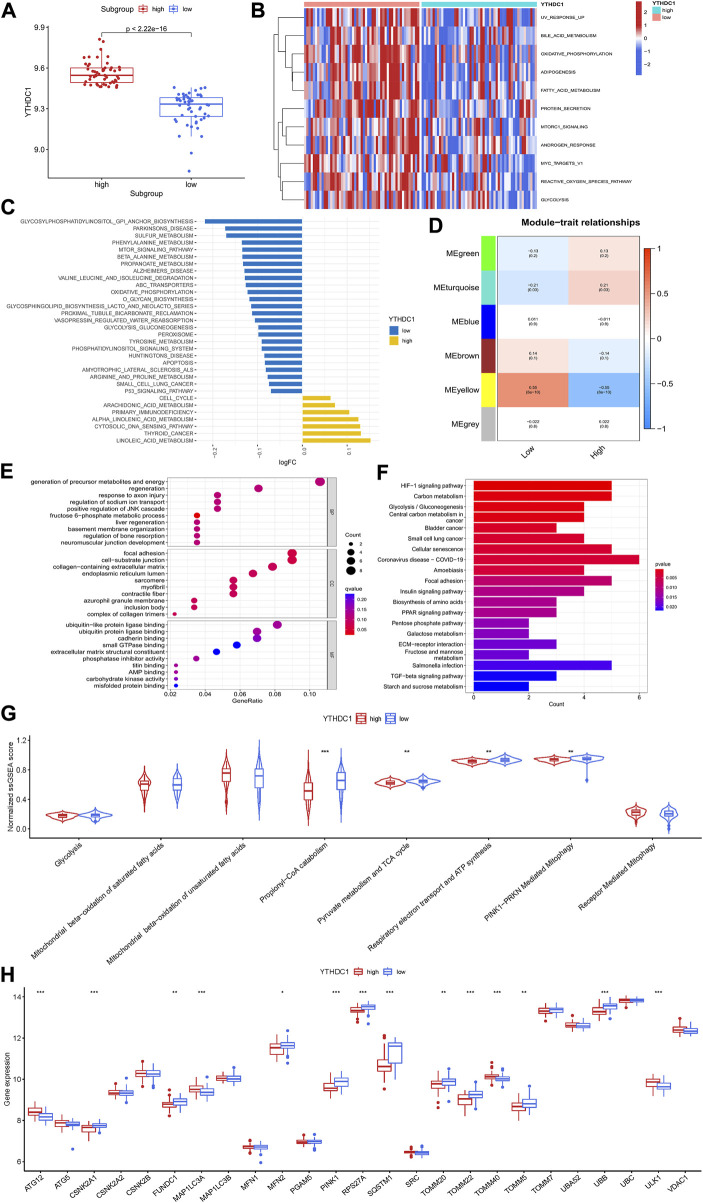
FIGURE 7.
Biological enrichment analysis of the two m6A subgroups based on YTHDC1 expression. (A) Difference in the expression of YTHDC1 between subgroups (Wilcox rank sum test). (B) Different HALLMARKS pathways between distinct subgroups. (C) Different Kyoto Encyclopedia of Genes and Genomes pathways between distinct subgroups. (D) Correlation between the modules from weighted gene co-expression network analysis and YTHDC1 subgroups using spearman analysis. (E) Gene Ontology analysis of yellow module illustrated by bubble plot. (F) Kyoto Encyclopedia of Genes and Genomes analysis of yellow module illustrated by histogram. (G) Violin plot showing the difference in energy metabolism and mitophagy-related pathways between the two subgroups (Wilcox rank sum test). (H) Difference in the expression of mitophagy-related genes between the two subgroups (Wilcox rank sum test). TCA, tricarboxylic acid cycle. *p < 0.05, **p < 0.01, ***p < 0.001.

