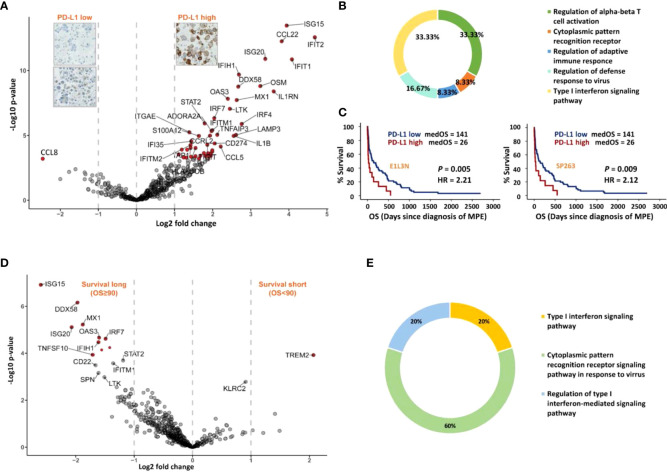
Figure 3.
Immune gene expression analysis according to MPE LADC PD-L1 expression (tumour cells) and patient survival. (A) Differential 730 genes expression analysis. Genes with twice fold expression change and FDR less than 0.05 were marked in red. (B) Chart showing the most important cell biological pathways upregulated in the PD-L1 high group from Gene Ontology (GO) analysis. (C) Kaplan-Meier survival analysis for patients with PD-L1 high versus low expressing tumours, using clones E1L3N and SP263. The P-value (P) of the log-rank test is indicated. (D) Differential gene expression (730 genes) analysis of patients with long and short-survival (cut-off = median OS, 90 days), respectively. Genes with 2 times fold expression change and FDR < 0.05 were marked in red. (E) Chart showing the most significant terms in the long-survival group (GO analysis). Only terms with corrected p-value < 0.05 were shown.

