Figure 4.
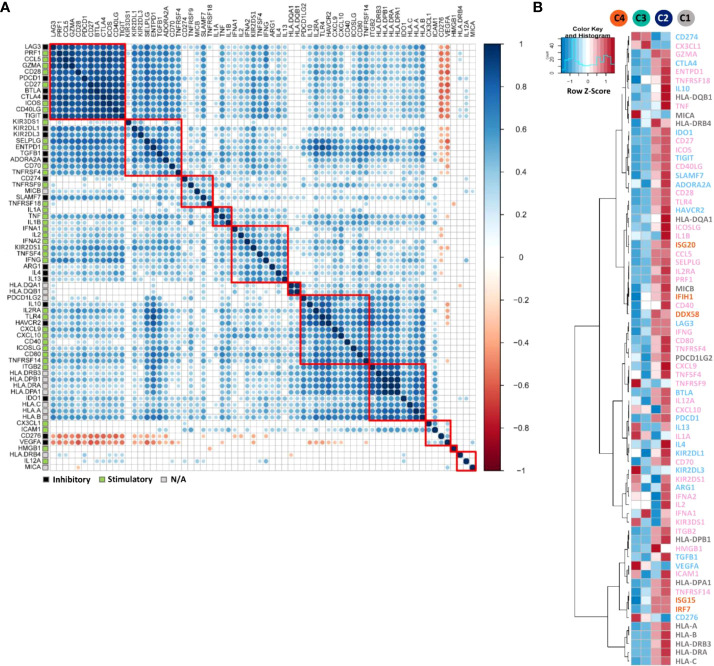
Correlation and expression analyses of immunomodulator genes. (A) Pearson correlation matrix showing the clustering and correlations of 68 immunomodulator genes. The correlation matrix was subjected to unsupervised hierarchical clustering using Euclidean distance measurement. Blue dots illustrate positive correlations, white ones no correlation (FDR ≥ 0.01), and red negative correlations. Bigger dot size indicates a smaller p-value of the correlation. Red squares indicate the individual clusters. Different gene modulatory functions were annotated in coloured squares on the left. Black indicates the inhibitory function, green stimulatory and grey modulatory function not known (N/A). (B) heatmap indicating the average mRNA expression of 68 immunomodulator genes together with five genes from long-survival relevant pathways such as RIG-1-like receptors (RLRs) and type 1 interferon pathways, among the four patient clusters C1-C4. mRNA expression data were normalised and unsupervised clustered using Euclidean distance measurement. For the gene expression level, relatively high level expressions are in red, low level in blue. On the right side of the figure, inhibitory gene names were marked in light blue, stimulatory ones were in pink, unknown modulatory function genes in grey and RLRs and type I interferon pathway relevant genes in orange.

