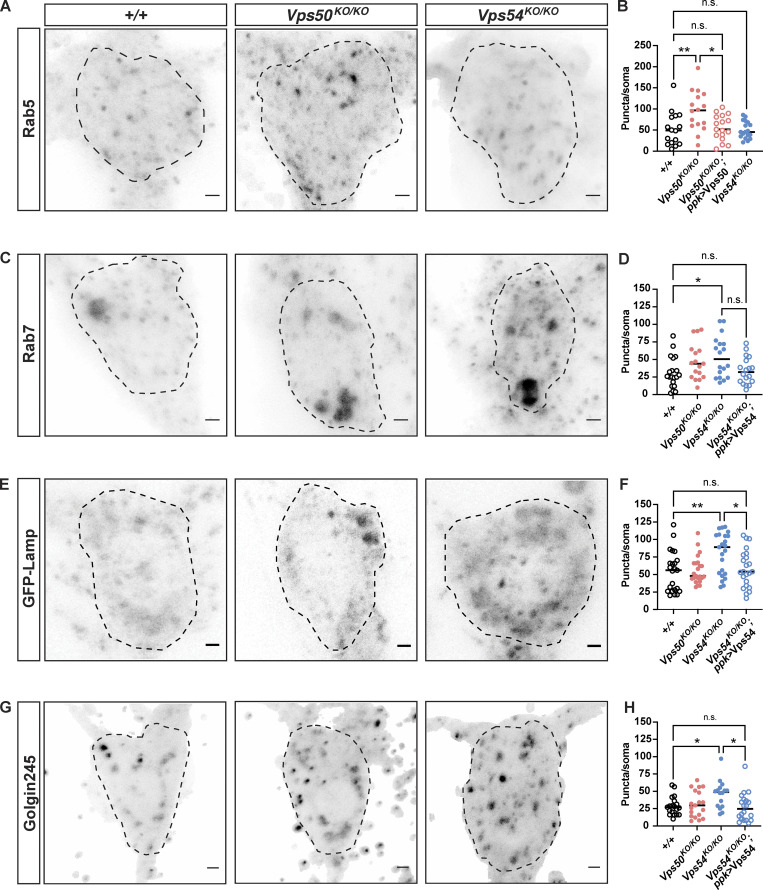
Figure 5.
Complex-specific impairments in organelle populations. (A) Maximum intensity z-projections of endogenous Rab5 staining in neurons from 1-d-old flies. Dashed lines indicate soma area. Scale bars = 2.5 μm. (B) Quantification of the number of Rab5 puncta/soma, n = 16–18 independent samples/genotype. For all graphs in this figure, each data point represents the average of 1–3 cells/sample. Data for each organelle marker was obtained from at least three independent experiments. All organelle data were analyzed by one-way ANOVA with Tukey’s post-test. +/+ vs. Vps50KO/KO **P = 0.0061, Vps50KO/KO vs. Vps50KO/KO; ppk > Vps50 *P = 0.0106. All other comparisons, n.s. P > 0.96. (C) Maximum intensity z-projections of endogenous Rab7 staining. (D) Quantification of the number of Rab7 puncta/soma, n = 17–20 independent samples/genotype. +/+ vs. Vps50KO/KO *P = 0.0251, Vps54KO/KO vs. Vps54KO/KO; ppk > Vps54 n.s. P = 0.0746. All other comparisons n.s. P > 0.37. (E) Maximum intensity z-projections of the transgene UAS-GFP-Lamp expressed in c4da neurons from +/+ (ppk > GFP-Lamp), Vps50KO/KO (Vps50KO, UAS-GFP-Lamp/Vps50KO; ppk-Gal4, UAS-CD4-tdTomato/+), Vps54KO/KO (Vps54KO, UAS-GFP-Lamp/Vps54KO; ppk-Gal4, UAS-CD4-tdTomato/+), and Vps54KO/KO (Vps54KO, UAS-GFP-Lamp/Vps54KO; ppk-Gal4, UAS-CD4-tdTomato/UAS-Vps54). (F) Quantification of the number of GFP-Lamp puncta/soma, n = 23 independent samples/genotype. +/+ vs. Vps54KO/KO **P = 0.006, Vps54KO/KO vs. Vps54KO/KO; ppk > Vps54 *P = 0.0268. All other comparisons n.s. P > 0.99. (G) Maximum intensity z-projection of endogenous Golgin245 staining. (H) Quantification of the number Golgi245 puncta/soma, n = 18–21 independent samples/genotype. +/+ vs. Vps54KO/KO *P = 0.0425. Vps54KO/KO vs. Vps54KO/KO; ppk > Vps54 *P = 0.0173. All other comparisons n.s. P > 0.12. For additional organelle parameters, see Fig. S3.

