Figure 6.
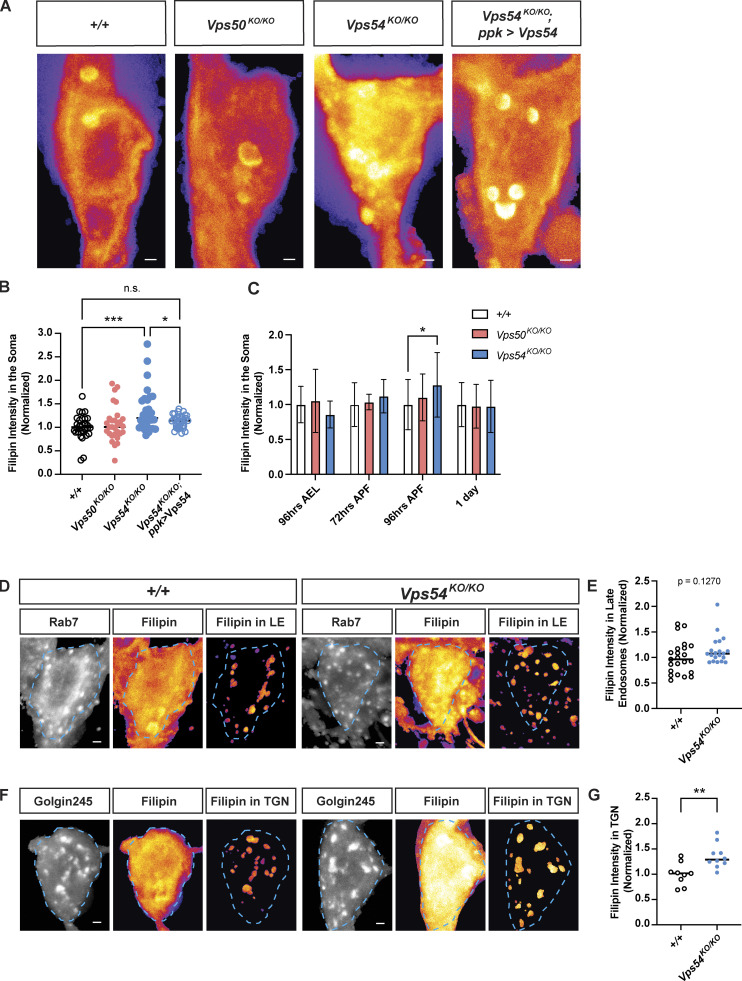
Accumulation of free sterol at the TGN during dendrite regrowth in GARP deficient neurons. (A) Maximum intensity z-projections showing total filipin staining in the soma of +/+, Vps50KO/KO, Vps54KO/KO, and Vps54KO/KO; ppk > Vps54 neurons at 96 h APF. Scale bar = 1 μm. Images are pseudocolored with the fire LUT in which cooler colors indicate lower and hotter colors indicate higher fluorescence intensity values. Bright spots within the soma appear to overlap with the ER marker Sec61β (see Fig. S4, C and D). (B) Quantification of filipin fluorescence intensity at 96 h APF, n = 30–33 independent samples/genotype. Data were normalized to average control value for each experiment to account for inter-experimental differences in filipin intensity. Analyzed by one-way ANOVA with Tukey’s post-test. +/+ vs. Vps54KO/KO ***P = 0.0004, Vps54KO/KO vs. Vps54KO/KO; ppk > Vps54 *P = 0.0463. Other comparisons n.s. P > 0.45. (C) Quantification of filipin fluorescence intensity in +/+, Vps50KO/KO, Vps54KO/KO neurons across development. N ≥ 17 independent samples/genotype at each timepoint. Analyzed by two-way ANOVA with Šidák’s multiple comparison’s correction, *P = 0.0312. (D–G) Sterol levels in organelles. (D) For each genotype, left and middle panels show maximum intensity projections of Rab7 and filipin staining. To obtain the filipin signal from late endosomes, a mask was generated using the Rab7 z-stack and applied to the filipin z-stack. Right panel shows maximum intensity projection of the extracted filipin signal in Rab7+-late endosomes. Dashed line shows soma area. (E) Quantification of late endosome-associated filipin staining. Analyzed by two-sided Mann-Whitney U test, n.s. P = 0.1229. N = 20–23 independent samples/genotype. (F) As in D, except with Golgin245 to obtain filipin signal in the TGN. (G) Quantification of TGN-associated filipin signal. Analyzed by unpaired two-sided t test, **P = 0.0038. N = 9–10 independent samples/genotype. Samples were collected from at least three independent experiments.

