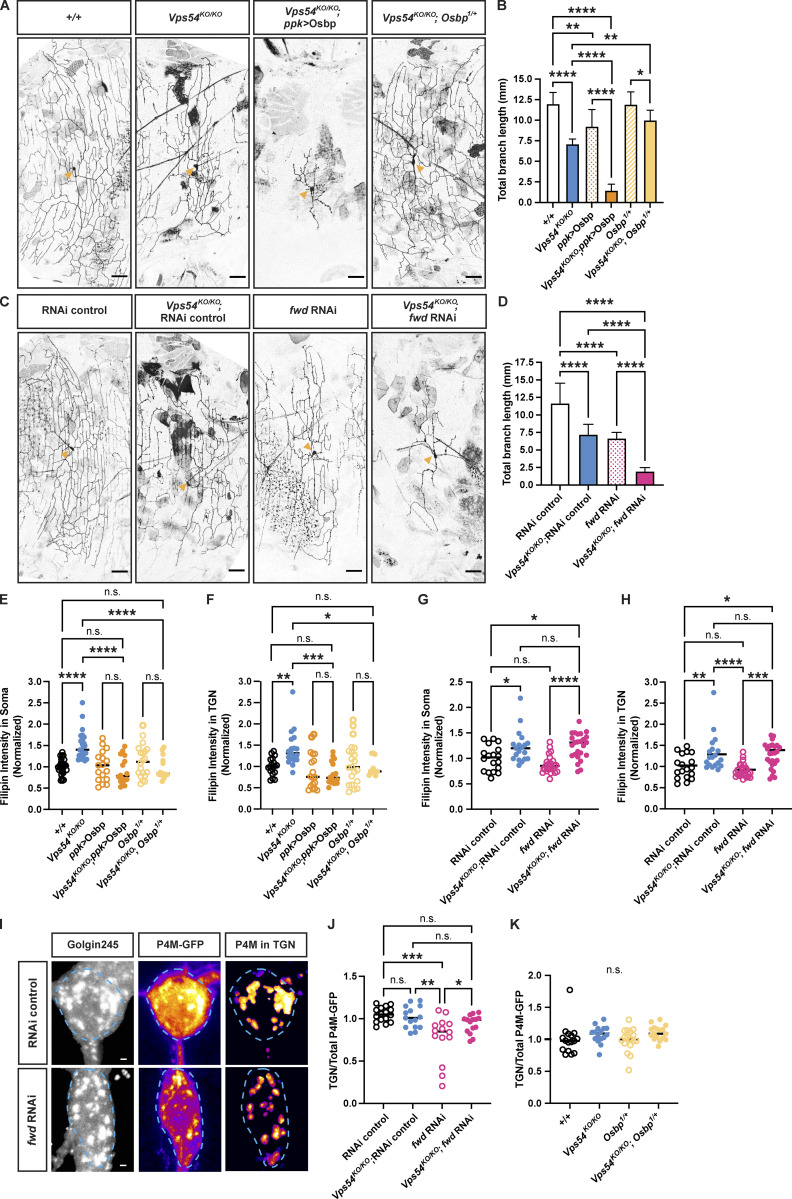
Figure 7.
Targeting specific lipid regulators at the TGN modulates GARP KO phenotypes. (A) Representative maximum intensity z-projections of c4da neurons from 7-d-old males showing the effect of Osbp manipulation in the Vps54KO/KO background. Scale bar = 50 μm. Yellow arrows point to the soma. (B) Quantification of total dendrite branch length. Data presented as mean ± SD. N ≥ 10 independent neurons/genotype except +/+ and Vps54KO/KO (both n = 6). Analyzed by one-way ANOVA with Tukey’s post-test. ****P < 0.0001. +/+ vs. ppk > Osbp **P = 0.0041. Vps54KO/KO vs. Vps54KO/KO; Osbp1/+ **P = 0.0027. Osbp1/+ vs. Vps54KO/KO; Osbp1/+ *P = 0.039. (C) Representative maximum intensity z-projections of c4da neurons from 7-d-old males showing the effect of fwd RNAi knockdown using the ppk-Gal4 to drive RNAi expression. (D) Quantification of total dendrite branch length. Data presented as mean ± SD. N ≥ 8–14 independent neurons/genotype. ****P < 0.0001. (E and F) Quantification of filipin fluorescence intensity showing the effect of Osbp manipulation in Vps54KO/KO neurons at 96 h APF. N ≥ 13 independent samples/genotype. Analyzed by one-way ANOVA with Šidák’s post-test. (E) Total filipin staining in the soma. +/+ vs. Vps54KO/KO, Vps54KO/KO vs. Vps54KO/KO; ppk > Osbp, and Vps54KO/KO vs. Vps54KO/KO; Osbp1/+ ****P < 0.0001. All other comparisons n.s. P > 0.76. (F) TGN-associated filipin staining. +/+ vs. Vps54KO/KO **P = 0.0079. Vps54KO/KO vs. Vps54KO/KO; ppk > Osbp ***P = 0.0001. Vps54KO/KO vs. Vps54KO/KO; Osbp1/+ *P = 0.0362. Other comparisons n.s. P > 0.83. (G and H) Quantification of filipin fluorescence intensity showing the effect of fwd knockdown in Vps54KO/KO neurons, n ≥ 18 independent samples/genotype. (G) Total filipin staining in the soma. RNAi control vs. Vps54KO/KO; RNAi control *P = 0.0275. RNAi control vs. Vps54KO/KO; fwd RNAi *P = 0.0123. fwd RNAi vs. Vps54KO/KO; fwd RNAi ****P, 0.0001. N.s. P > 0.38. (H) TGN-associated filipin staining. RNAi control vs. Vps54KO/KO; RNAi control **P = 0.0099. RNAi control vs. Vps54KO/KO; fwd RNAi *P = 0.0231. fwd RNAi vs. Vps54KO/KO; fwd RNAi ***P = 0.0002. N.s. P > 0.69. (I) Representative P4M-GFP images from RNAi control and fwd RNAi neurons. Left and middle panels show maximum intensity projections of Golgin245 and P4M-GFP, respectively. Right panel shows maximum intensity projection of extracted TGN-associated P4M-GFP signal. P4M-GFP images pseudocolored with the fire LUT. Dashed line shows soma area. Scale bar = 1 μm. (J) Quantification of TGN associated P4M-GFP fluorescence intensity from fwd RNAi samples. TGN P4M-GFP intensity levels normalized to total soma levels to account for variation in reporter expression. N = 15–16 independent samples/genotype. RNAi vs. fwd RNAi ***P = 0.0001. Vps54KO/KO; fwd RNAi vs. Vps54KO/KO; RNAi control **P = 0.0011. fwd RNAi vs. Vps54KO/KO; fwd RNAi *P = 0.0438. N.S. P > 0.23. (K) Same as in J but for Osbp samples, n.s. P > 0.22.

