Figure 8.
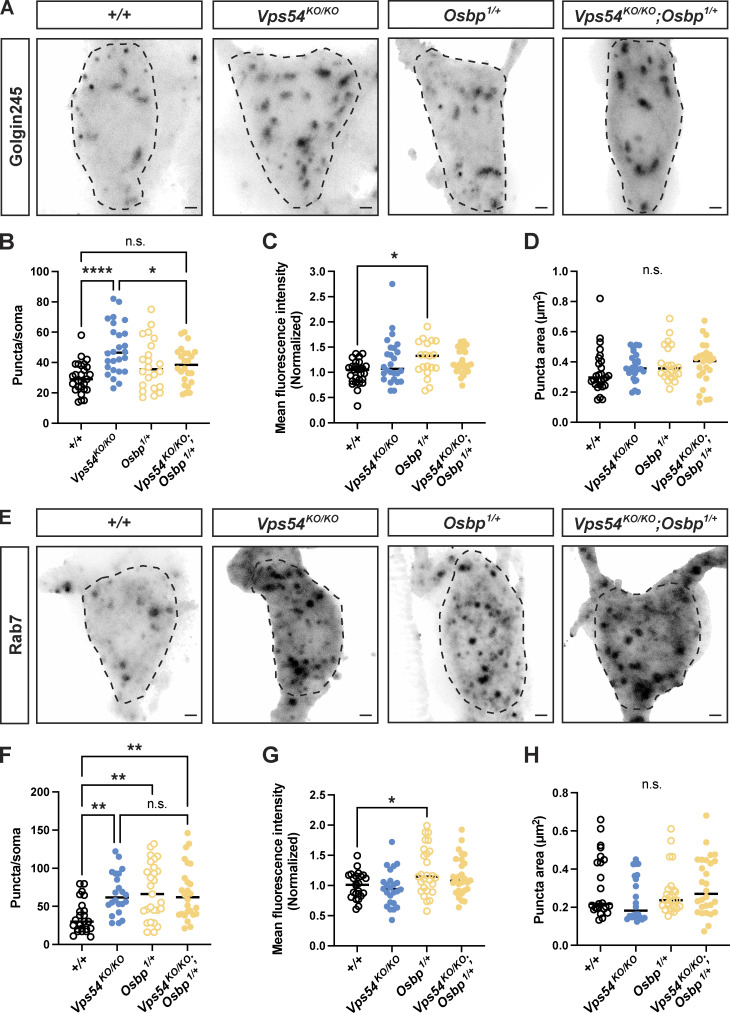
Depletion of Osbp rescues TGN but not late endosomal morphology in GARP KO neurons. (A) Representative maximum intensity z-projections of endogenous Golgin245 staining from c4da neurons in pupae 96 h APF. Dashed line shows soma area. Scale bar = 1 μm. For B–D, n = 22–27 independent samples/genotype. All data in this figure were analyzed by one-way ANOVA with Tukey’s post-test. Samples were obtained from at least three independent experiments. (B) Quantification of the number of Golgin245 puncta/soma. +/+ vs. Vps54KO/KO ****P < 0.0001, Vps54KO/KO vs. Vps54KO/KO; Osbp1/+ *P = 0.0404. +/+ vs. Vps54KO/KO; Osbp1/+ n.s. P = 0.1728. (C) Golgin245 fluorescence intensity. +/+ vs. Osbp1/+ *P = 0.0406. +/+ vs. Vps54KO/KO n.s. P = 0.0808, +/+ vs. Vps54KO/KO; Osbp1/+ P = 0.0683. (D) Golgin puncta area. n.s. P > 0.24. (E) Representative maximum intensity z-projections of endogenous Rab7 staining from c4da neurons in pupae 96 h APF. (F–H) For F–H, n = 23–28 independent samples/genotype. (F) Quantification of the number of Rab7 puncta in the soma. +/+ vs. Vps54KO/KO **P = 0.0067. +/+ vs. Osbp1/+ **P = 0.0013. +/+ vs. Vps54KO/KO; Osbp1/+ **P = 0.0029. Other comparisons n.s. P > 0.98. (G) Rab7 fluorescence intensity. +/+ vs. Osbp1/+ **P = 0.0404. Other comparisons P > 0.11. (H) Rab7 puncta area. All comparisons, n.s. P > 0.36.

