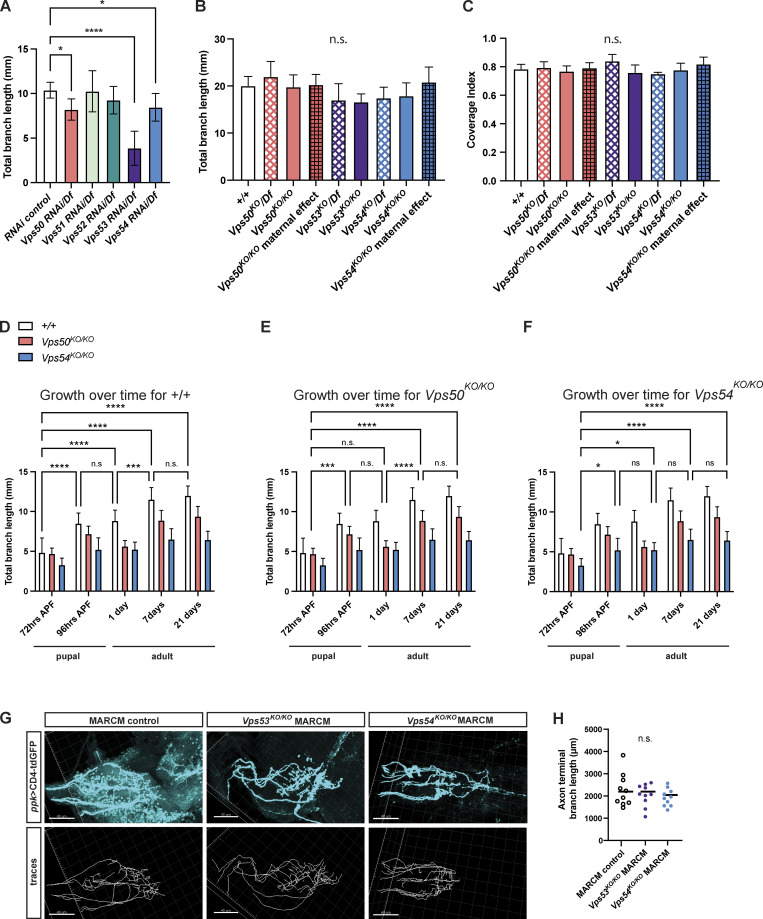
Figure S2.
Additional support for developmental emergence of a dendritic, but not axonal, phenotype. (A) Quantification of total dendrite branch length of c4da neurons expressing RNAi against GARP and EARP complex components in 7 d adult males. RNAi are driven by ppk-Gal4 in a heterozygous chromosomal deficiency background, n = 7–13 independent neurons/genotype. RNAi control vs. Vps50 RNAi/Df *P = 0.0217, RNAi control vs. Vps54 RNAi/Df *P = 0.0238, RNAi control vs. Vps53 RNAi/Df ****P < 0.0001, remaining comparisons, P > 0.31. (B) Total dendrite branch length of c4da neurons from 3rd instar larvae 96 h after egg lay (AEL). For maternal effect samples, we examined homozygous KO flies from homozygous KO females crossed to heterozygous KO males. Comparison of each genotype to +/+ P > 0.16. (C) Coverage index (neuron area/receptive field area) of neurons from 96 h AEL larvae. Comparison of each genotype to +/+, P > 0.11. For B and C, n = 6–9 neurons/genotype. A–C were analyzed by one-way ANOVA with Tukey’s post-test. Data presented as mean ± SD. (D–F) Additional analysis for data in Fig. 3 E. Graphs show statistics comparing total dendrite length across timepoints for (D) +/+, (E) Vps50KO/KO, and (F) Vps54KO/KO. Analyzed by two-way ANOVA with Tukey’s post-test. Data presented as mean ± SD. Please see Table S2 for the list of P-values. (G and H) Representative images of axon terminals of FRT40A MARCM control, Vps53KO/KO MARCM, and Vps54KO/KO MARCM clones from 6- to 8-d-old adult ventral nerve cord. Top, CD4-tdGFP labeling the neuronal membrane. Bottom: traces of axon terminals. Scale bar = 40 μm. (H) Quantification of axon terminal branch length, n = 10 independent clones/genotype. Analyzed by one-way ANOVA with Tukey’s post-test, n.s. P > 0.41. Samples for all experiments were collected from at least three independent experiments.

