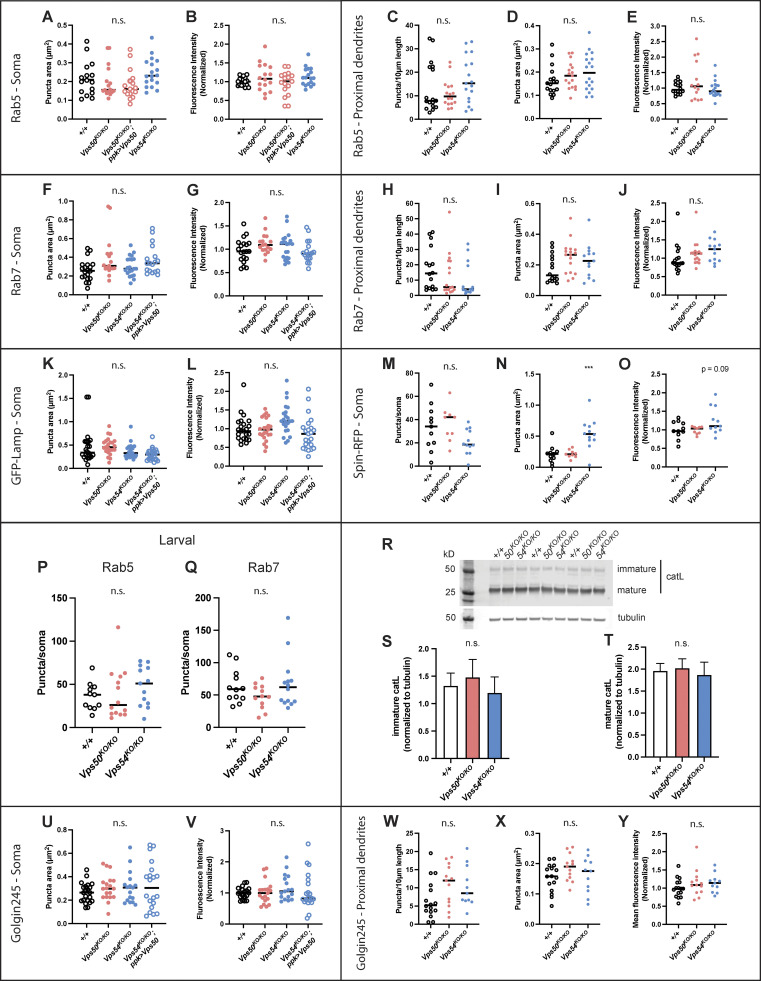
Figure S3.
Additional analyses of organelle phenotypes in Fig. 5. (A–E) Additional quantification of Rab5 data from Fig. 5, A and B. Quantification of (A) puncta area and (B) mean fluorescence intensity in the soma. n = 16–18 independent samples/genotype. For all graphs in this figure, each data point represents the average of 1–3 cells/sample. Data for each organelle marker was obtained from at least three independent experiments. All organelle data were analyzed by one-way ANOVA with Tukey’s post-test. All comparisons n.s. P > 0.10. Quantification of Rab5 (C) puncta number/10 μm of dendrite length, (D) puncta area, and (E) mean fluorescence intensity in proximal dendrites. All comparisons were n.s. P > 0.15. (F–J) Additional quantification of Rab7 data from Fig. 5, C and D, n = 17–20 independent samples/genotype. Quantification of (F) Rab7 puncta area. +/+ vs. Vps50KO/KO n.s. P = 0.0526. All other comparisons n.s. P > 0.14. (G) Rab7 mean fluorescence intensity in the soma. All comparisons n.s. P > 0.14. (H–J) Quantification of Rab7 in proximal dendrites. (H) Puncta number/10 μm of dendrite length, n.s. P > 0.34 for all comparisons. (I) Rab7 puncta area. +/+ vs. Vps50KO/KO puncta area n.s. P = 0.077. Other comparisons n.s. P > 0.25. (J) Rab7 mean fluorescence intensity, n.s. P > 0.25. (K and L) Additional quantification of GFP-Lamp data from Fig. 5, E and F. N = 23 independent samples/genotype. (K) GFP-Lamp puncta area +/+ vs. Vps54KO/KO; ppk > Vps54 n.s. P = 0.0581. All other comparisons n.s. P > 0.44. (L) GFP-Lamp mean fluorescence intensity. Vps54KO/KO vs. Vps54KO/KO; ppk > Vps54 **P = 0.0045. All other comparisons n.s. P > 0.10. (M–O) Quantification of spin-RFP puncta in the soma. N = 10–12 independent samples/genotype. (M) Spin-RFP puncta number/soma. All comparisons n.s. P > 0.07. (N) Spin-RFP puncta area +/+ vs. Vps54KO/KO ***P = 0.0003. +/+ vs. Vps50KO/KO n.s. P = 0.9942. (O) Quantification of spin-RFP mean fluorescence intensity. All comparisons n.s. P > 0.09. (P and Q) Quantification of endosomes from the soma of class IV da neurons from larvae 96 h after egg lay for (P) rab5 (n = 11–15 independent samples/genotype) and (Q) rab7 (n = 10–14 independent samples/genotype). (R) Representative Western blot of head lysates from 1 d old +/+, Vps50KO/KO and Vps54KO/KO flies probed with antibodies against cathepsin L and tubulin. (S and T) Quantification of the (S) immature and (T) mature forms of cathepsin L. Samples are technical triplicates from two independent experiments. Analyzed by one-way ANOVA with Tukey’s post-test, n.s. P > 0.23. U-Y Additional quantification of Golgin245 data from Fig. 5, G and H. N = 18–21 independent samples/genotype. (U and V) Quantification of Golgin245 (U) puncta area and (V) mean fluorescence intensity from the soma. All comparisons n.s. P > 0.5. (W–Y) Quantification of Golgin245 (W) puncta number/10 μm of dendrite length, (X) puncta area and (Y) mean fluorescence intensity in proximal dendrites. All comparisons n.s. P > 0.14. Source data are available for this figure: SourceData FS3.

