Figure S4.
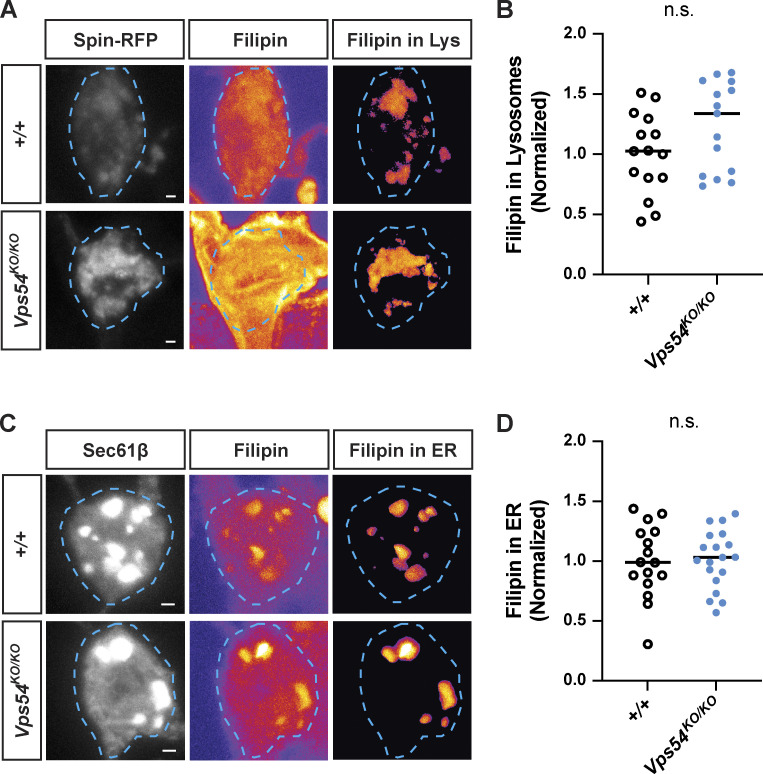
Sterol accumulation in GARP deficient neurons. (A) Filipin staining in lysosomes. For each genotype, left and middle panels show maximum intensity projections of Spin-RFP and filipin staining from 96 h APF pupae. Filipin images are pesudocolored with the fire LUT which cooler colors indicate lower and hotter colors indicate higher fluorescence intensity values. Scale bar = 1 μm. To obtain the filipin signal from lysosomes, a mask was generated using the Spin-RFP z-stack and applied to the filipin z-stack. Right panel shows maximum intensity projection of the extracted filipin signal in Spin+-lysosomes. (B) Quantification of lysosome-associated filipin staining. Analyzed by two-sided Mann-Whitney U test, n.s. P = 0.1064. N = 15 independent samples/genotype. (C) As in A, except with Sec61β to obtain filipin signal in the ER. (D) Quantification of ER-associated filipin signal. Analyzed by unpaired two-sided t test, n.s. P = 0.9006. N = 16–19 independent samples/genotype.

