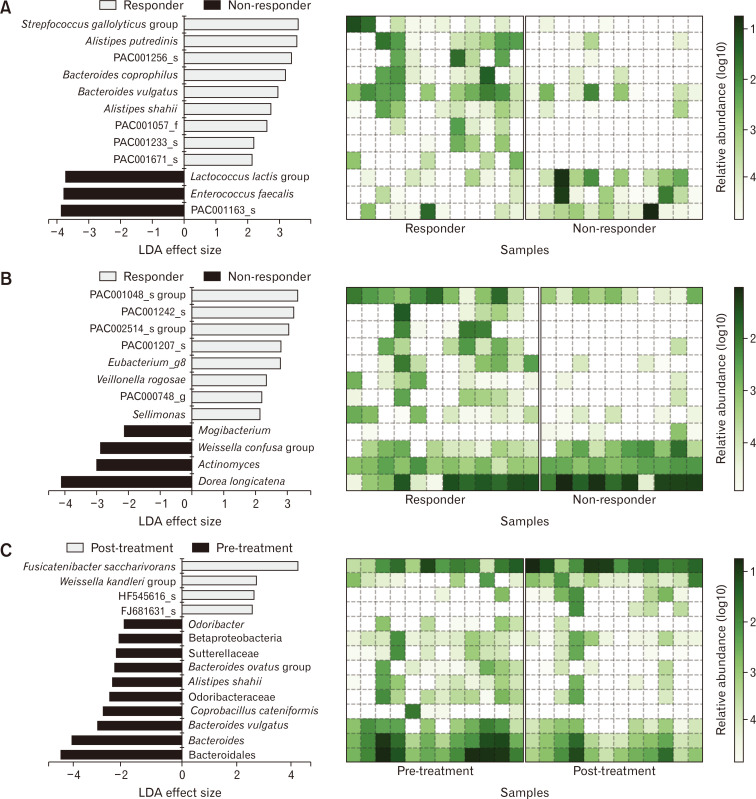
Figure 5.
Biomarker identification of responders to probiotic treatment. The potential biomarkers identified by the linear discriminant analysis (LDA) effect size algorithm are shown with heatmaps of the log-scaled relative abundance. Each plot represents biomarkers of the responders and non-responders in the (A) pre-treatment samples and (B) post-treatment samples and (C) biomarkers of the pre- and post-treatment samples in the responder group.

